

Credit Weekly: The Anatomy of AI Infrastructure Credit
A data pack on the credit market financing AI, what it is made of, and how it prices.

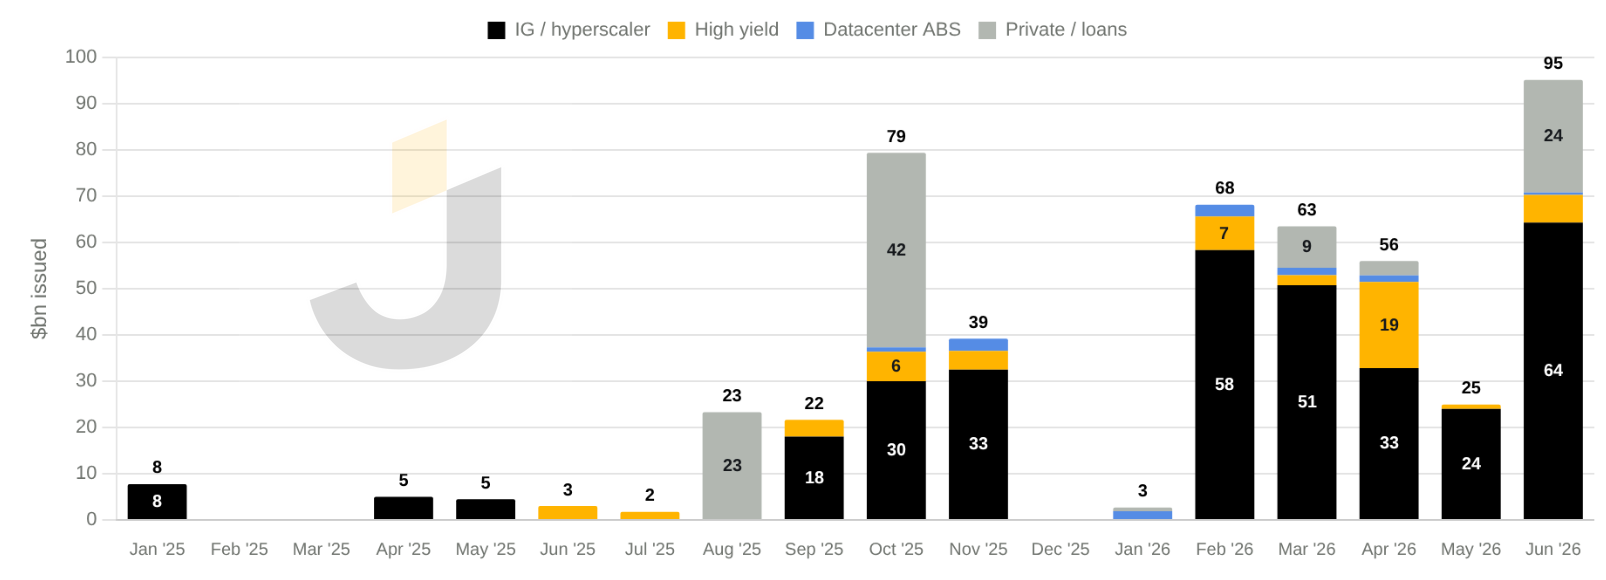
The AI buildout is usually framed as an equity story. It is increasingly a credit one. Roughly $500bn of debt now finances the buildout, across more than 200 instruments: hyperscaler bonds, neocloud high yield, datacenter securitizations, private placements, and construction loans. Most of it did not exist 18 months ago.
Issuance ran at a few billion dollars a month in early 2025, then inflected in the autumn and has since run at $50bn+ a month. That is too large to treat as an equity side debate or a venture financing story. The buildout now depends on credit investors continuing to fund it, roll it, and eventually refinance it.
This issue is a data pack on the AI infrastructure credit market: what it is made of, how it prices, and what the spread dispersion says about where investors think the risk actually sits.
Free Issue Sponsored By 9fin:

AI Chat — Ask complex questions across 9fin’s full data set (covenants, cap tables, financials, filings, news, and 9fin analysis) and get a fully cited answer in seconds. Effortlessly screen for opportunities, deep-dive into a credit and track evolving situations in real-time.
Research Grid — Compare credits across metrics, outlooks and key risks using 9fin’s frameworks or your own questions. Produce consistent, side-by-side analysis in minutes so you can spot outliers instantly and track changes in fundamentals.
Structure drives the spread
The spread range in AI infrastructure is less about one asset pricing differently and more about where the creditor sits in the stack.
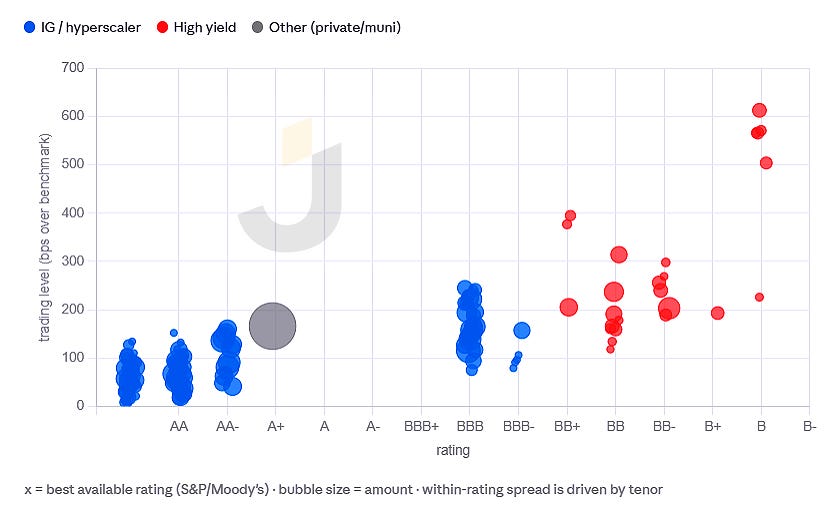
At the tight end, senior datacenter ABS can clear around 120bps, supported by lease cash flows, tenant credit, collateral, and tranche subordination. At the wide end, neocloud corporate debt can trade closer to 600bps, where the lender is taking enterprise risk tied to compute demand, customer concentration, GPU residual value, and refinancing access.
Both sit inside the same AI infrastructure buildout, but they are not the same exposure. One is closer to a structured claim on contracted datacenter cash flow. The other is closer to a corporate claim on the economics of selling compute. The spread range is the market separating those claims.
That distinction matters because the labels can obscure the risk. “AI debt” includes hyperscaler bonds, leased datacenter paper, ABS tranches, private placements, construction loans, and merchant compute debt. The underlying theme is similar, but the creditor claim is not.
The bands overlap, which is where the relative value sits. The widest paper in one structure can price near or through the tightest paper in another. That is the useful part of the data: not that every instrument is comparable, but that the market is still drawing the boundaries between structure, borrower, tenor, and demand exposure.
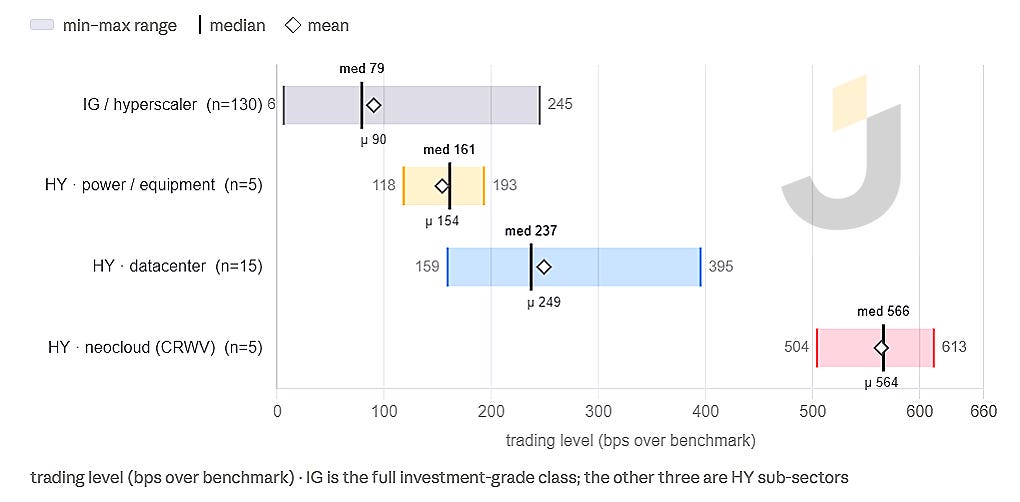
High yield separates the operators from the compute bet
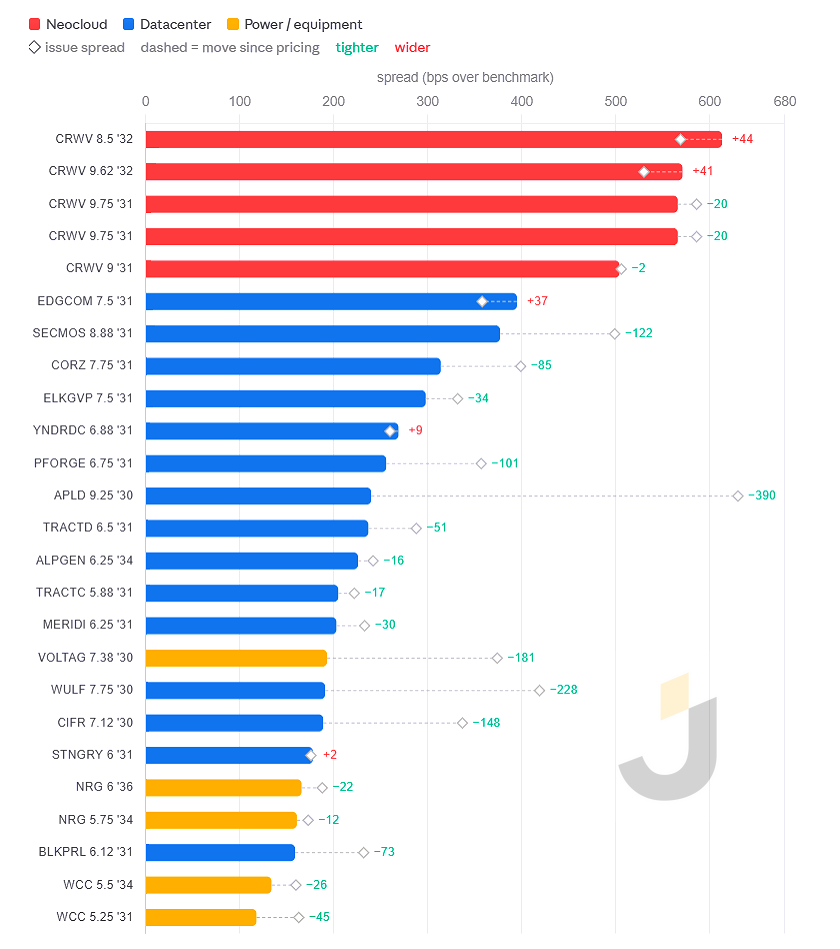
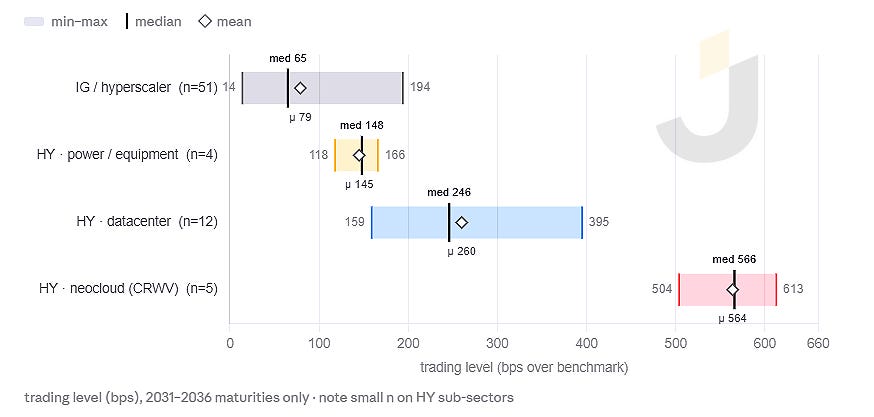
Inside the high-yield and frontier part of the market, the ordering is cleaner if you separate three groups: datacenter and colocation names with contracted tenants, power and equipment names tied to the buildout, and neocloud or merchant compute names taking direct demand risk.
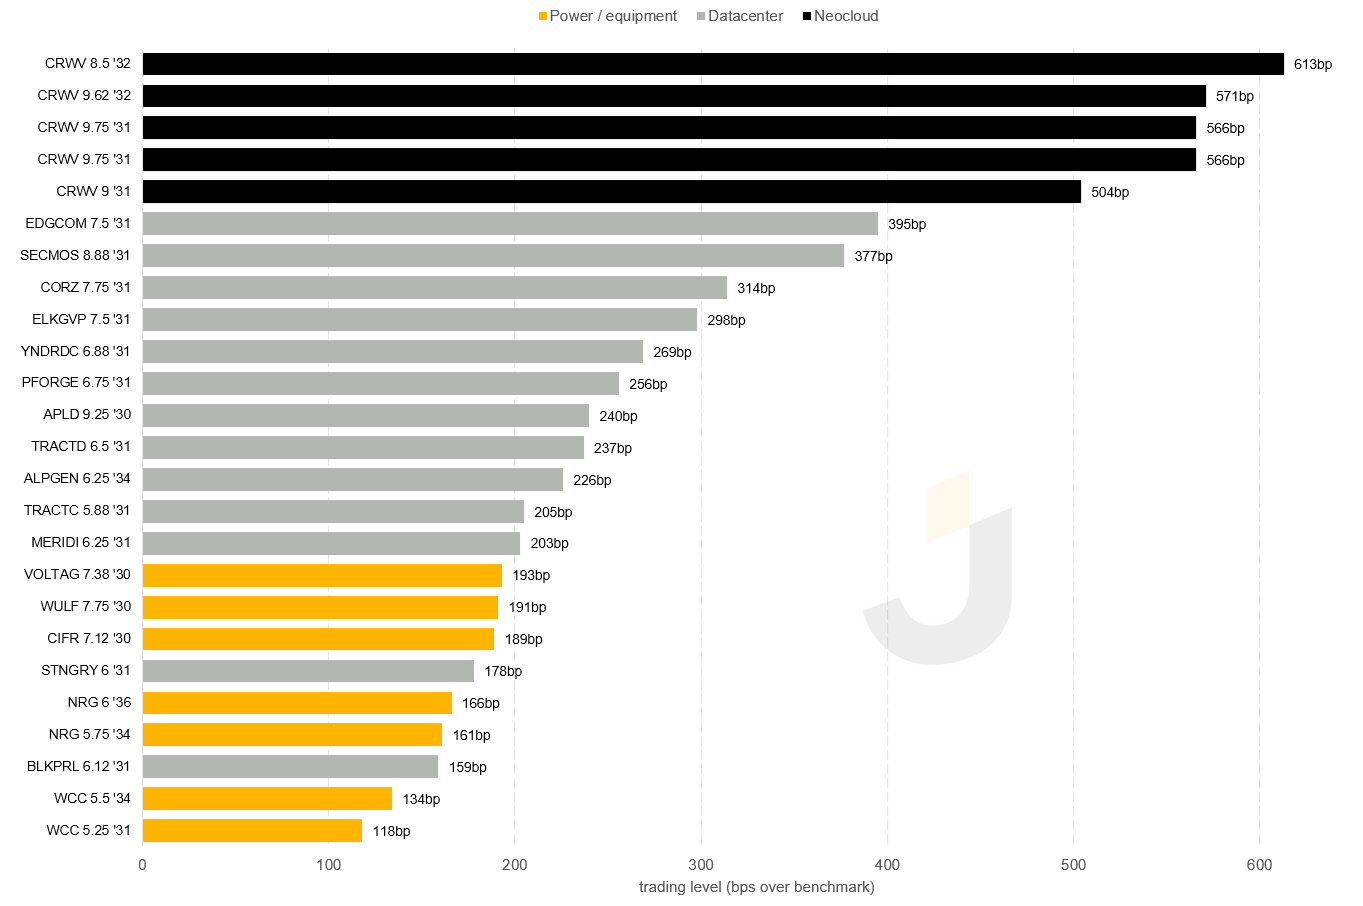
The contracted datacenter names generally trade through the merchant compute names. Credits backed by leased capacity, customer contracts, or infrastructure-like assets cluster well inside CoreWeave, while power and equipment names sit in their own part of the stack. CoreWeave, the only neocloud credit in the set and the name most directly exposed to selling compute, trades north of 500bps, roughly 110bps wide of the next datacenter name below it.
One way to read the ordering is that the market is more comfortable underwriting contracted infrastructure exposure than merchant compute demand. A leased datacenter credit depends on tenant quality, lease durability, asset location, power access, and residual value. A merchant compute credit depends more directly on GPU utilization, customer demand, pricing, refinancing access, and the residual value of the hardware.
That distinction matters because the collateral is different. A claim on a datacenter or colocation name may run through contracted customers and powered infrastructure. A claim on a merchant GPU cloud is much more exposed to chips that depreciate quickly, are worth less off the stack they were deployed on, and may be difficult to control if the borrower is also dependent on third-party space, power, and cooling.
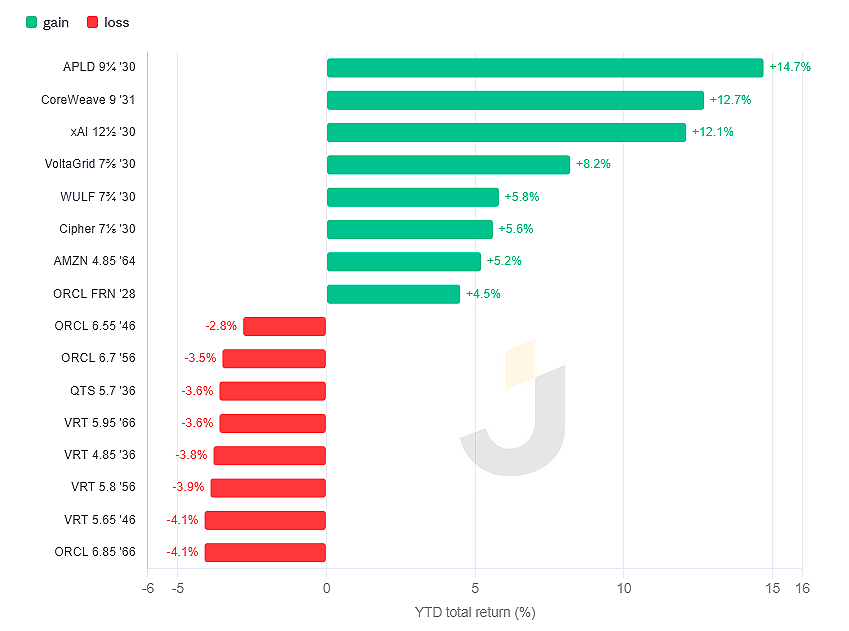
The move since pricing reinforces the split. Over the period in this data, most of the datacenter and infrastructure-linked high-yield names rallied: Applied Digital tightened about 390bps, from 630bps at issue to 240bps, with WULF in 228bps, VoltaGrid 181bps, and Cipher 148bps. CoreWeave was the exception, with its longer 2032 paper widening slightly since recent issuance.
IG curves are separating
The IG part of the market is less volatile, but the curves are not moving as one. Oracle and Meta sit wide of the tighter large-cap cluster, while Apple, Alphabet, Amazon, and Nvidia remain the lower-spread group.
Part of that is structural. Oracle is BBB, longer-dated, supply-heavy, and more levered than the AA large-cap issuers, so it should not trade on top of Apple, Amazon, or Alphabet. Meta is a cleaner comparison but still has its own capex and duration profile. The point is not that the bond market has made a clean verdict on hyperscaler AI spending. It is that the widest IG curves are also the names where investors have more to underwrite: capex intensity, leverage trajectory, supply, and long-end duration.
Oracle’s long end trades around 214bps to 245bps, triple-digit wide of Amazon and Alphabet at comparable tenors, roughly 140bps over Amazon and 90bps over Meta at the long end. Meta’s long bonds trade around 120bps to 160bps. The tighter cluster, Apple, Alphabet, Amazon, and Nvidia, sits in a narrow band.
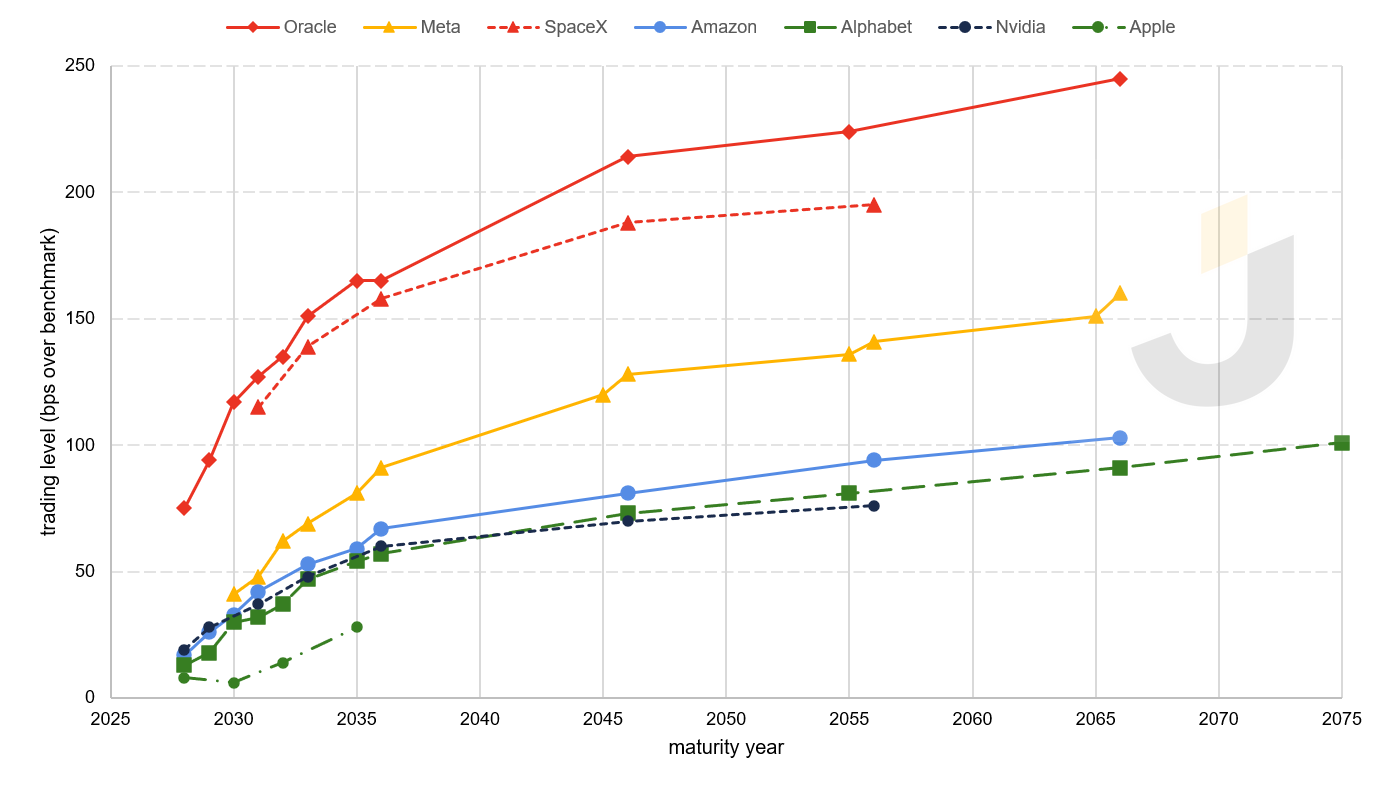
The useful observation is the dispersion, not a single-cause explanation. Oracle has widened in secondary rather than merely pricing cheap at issue, which suggests the market is continuing to reprice the name after the deal. But the spread gap likely reflects a mix of rating, tenor, leverage, supply, and capex exposure. I wrote about Oracle back in December of last year. Check it out here.

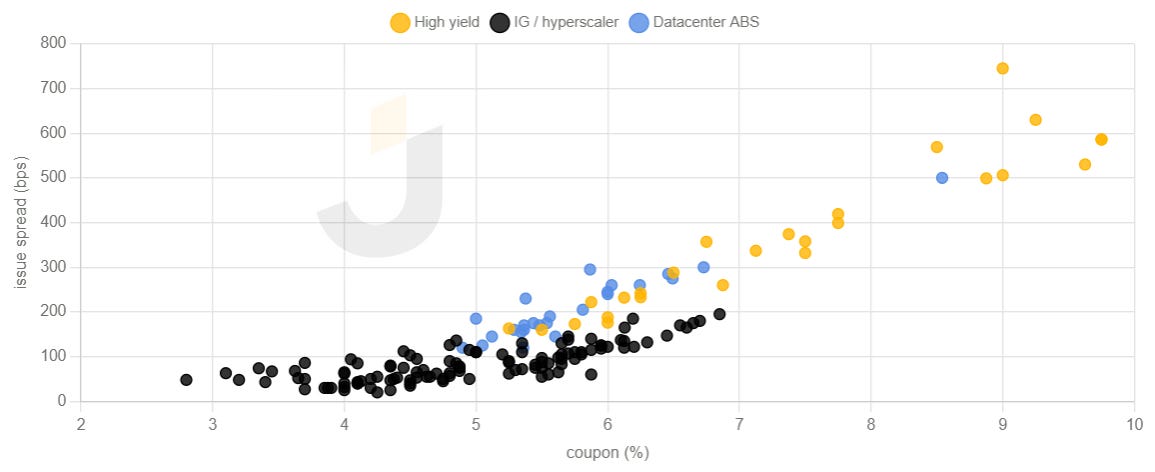
Dispersion within ratings is wide
Mapping bonds to ratings gives the expected downward-sloping relationship, but the dispersion inside each rating bucket is large. BBB spans roughly 75bps to 245bps at the Oracle long end. That is a 170bps range inside one rating category. The AA cluster is tighter.
Some of that range is tenor. Once maturities are matched, the rating signal still matters, but it does not explain the whole spread. In the 5-to-10-year part of the curve, the wide end of IG and the tight end of HY begin to overlap, especially around the power, equipment, and infrastructure-linked names. The seam between rating categories is therefore not a clean line; it is a zone where issuer, tenor, structure, and sector exposure matter as much as the rating label.
The same point shows up inside IG. The median IG curve flattens past 10 years, while the range around that median widens. The long end does not simply pay more because it is longer. It pays more in the names where the market has more to underwrite.
In this market, rating is the starting point. Issuer, tenor, structure, and exposure explain the rest.
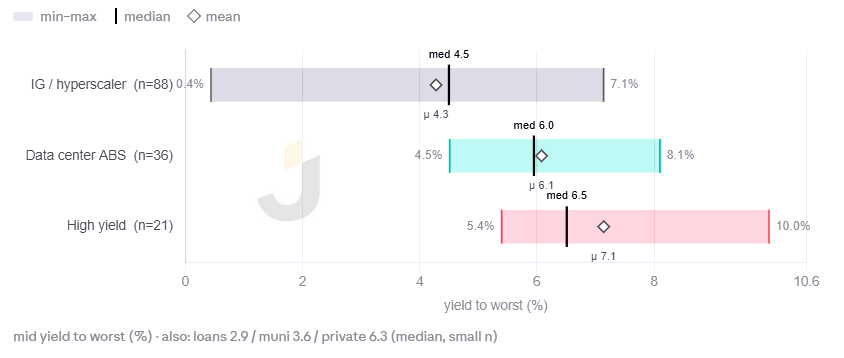
Spread gap versus all-in yield gap
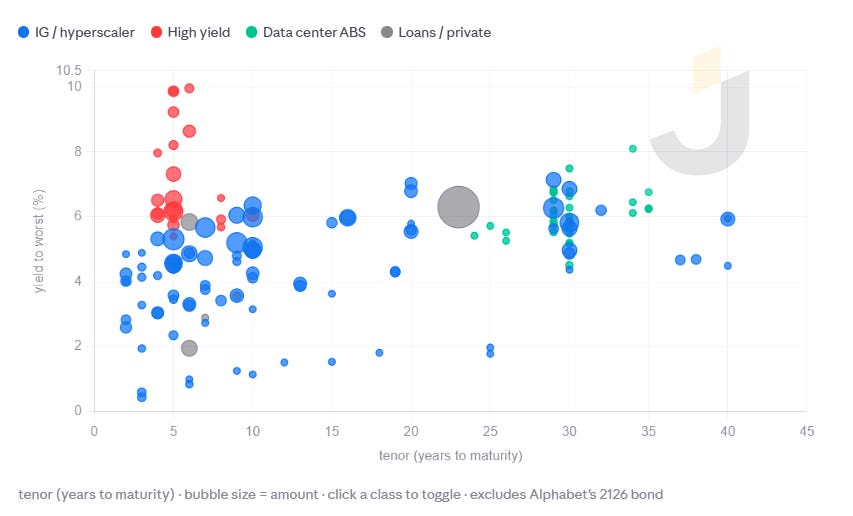
Measured by all-in yield, the HY-IG gap is about 200bps: median YTW is around 4.5% in IG and 6.5% in HY.
The difference comes from duration and curve exposure. IG contains more long-dated paper, where a larger share of the all-in yield comes from the Treasury curve. HY is concentrated in shorter 4-to-6-year tenors, where the spread is doing more of the work. The spread comparison and the yield comparison therefore tell different stories about how much extra income investors are actually receiving.
Total return shows the same split. Year to date, HY and datacenter names led with double-digit returns as spreads compressed on top of carry, while the worst performers were long-duration IG, including the Oracle and Vertiv long bonds, where rates and spread widening compounded. A single sector return figure averages those opposite ends into a number that fits neither.
The absolute yields are not especially high though. The widest name, CoreWeave, tops out near 10%. The point is that the spread gap makes the risk premium look larger than the actual income pickup once duration and curve exposure are taken into account.
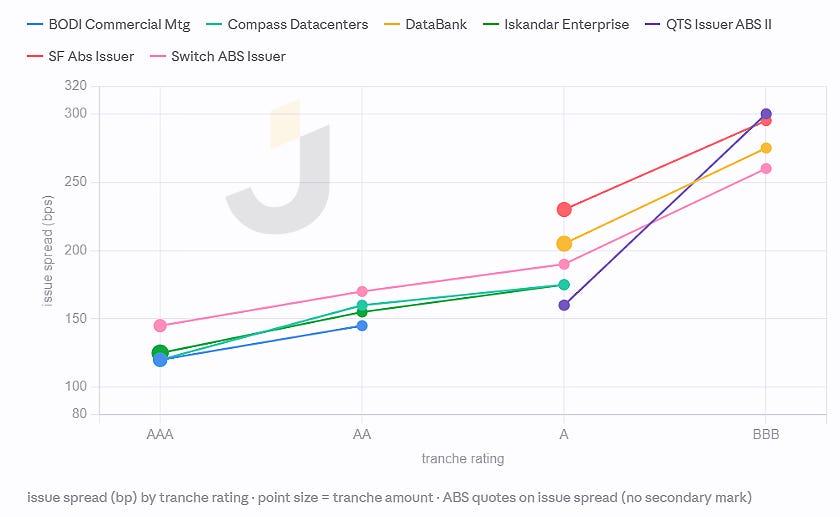
Datacenter ABS
Datacenter ABS is one of the less-covered corners of the market, and it has a clear structure to it. The enhancement curve is steep and fairly consistent across sponsors: senior AAA tranches clear around 120bps to 145bps, while the pickup to the BBB mezzanine is roughly 100bps to 175bps. QTS runs from 160bps to 300bps, and Switch from 145bps to 260bps.
On an all-in basis, the sector yields roughly 6% to 8%, not much below HY. The difference is the claim. ABS investors are taking long-duration exposure to contracted datacenter cash flows with tranche subordination, cash-flow controls, and collateral backing. HY investors are generally taking corporate credit risk, operating risk, refinancing risk, and, in the case of neoclouds, more direct compute-demand risk.
That does not make ABS risk-free or even directly comparable to HY. The tenors are long, which brings extension and refinancing risk. Tenants roll, collateral values can change, and the residual is still connected to the same AI infrastructure demand ecosystem, just filtered through lease and tenant performance. The point is not that ABS avoids the risk but that it transforms the risk into a different claim.
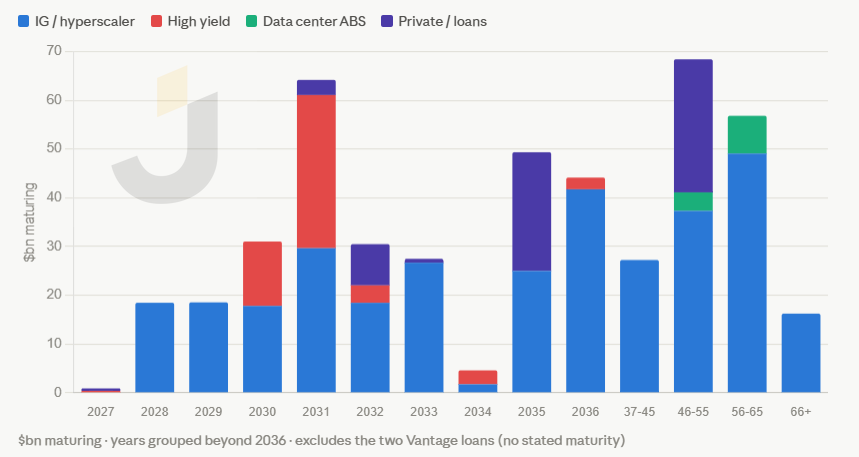
Maturities cluster in 2030-2031
The maturity profile is uneven. Roughly $45bn of HY paper comes due across 2030 and 2031, most of it issued in 2025. IG has no comparable cluster; it is laddered along the curve, with its largest single bucket out in 2036 and sizeable amounts beyond. The first concentrated refinancing need sits in the frontier part of the market. How spreads, demand, and market access look then will say a lot about how durable the current financing bid really is.
Four risks under one label
AI infrastructure is not a single trade. At least four distinct risks sit under the label:
Hyperscaler duration
Leased datacenter residual
Securitized tenant cash flow
Merchant compute demand
They are related, but they do not move together. Treating them as one exposure blends very different creditor claims and risk profiles.
More broadly, this looks like an asset class still forming, the way CLOs and datacenter REITs once did. Half a trillion dollars of debt has formed in roughly 18 months, and the taxonomy is still unsettled: neocloud vs. operator, property vs. securitization, corporate claim vs. asset-backed claim. The spread dispersion reflects that. The market is still deciding which labels matter and how much each claim should be paid.
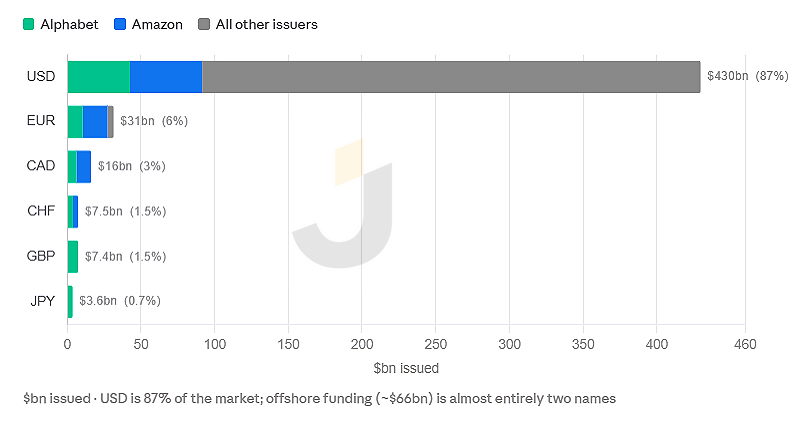
The funding base is also concentrated. USD is 87% of the market, and of the roughly $66bn issued offshore, almost all is Alphabet, across six currencies, and Amazon, across four. Everyone else funds in dollars.
Pulled together, the data shows a few consistent patterns.
Lease-backed and structured paper generally prices through merchant compute exposure. Inside IG, the wider curves are also the names where investors have more to underwrite, including capex intensity, leverage, supply, and duration. Ratings set the broad neighborhood, but issuer, tenor, structure, and exposure drive the trade. The spread gap overstates the income pickup once duration and curve exposure are taken into account. And the first concentrated refinancing cluster sits in 2030-2031.
The main message is simple: this is not one credit market yet. It is a set of claims being priced apart in real time.
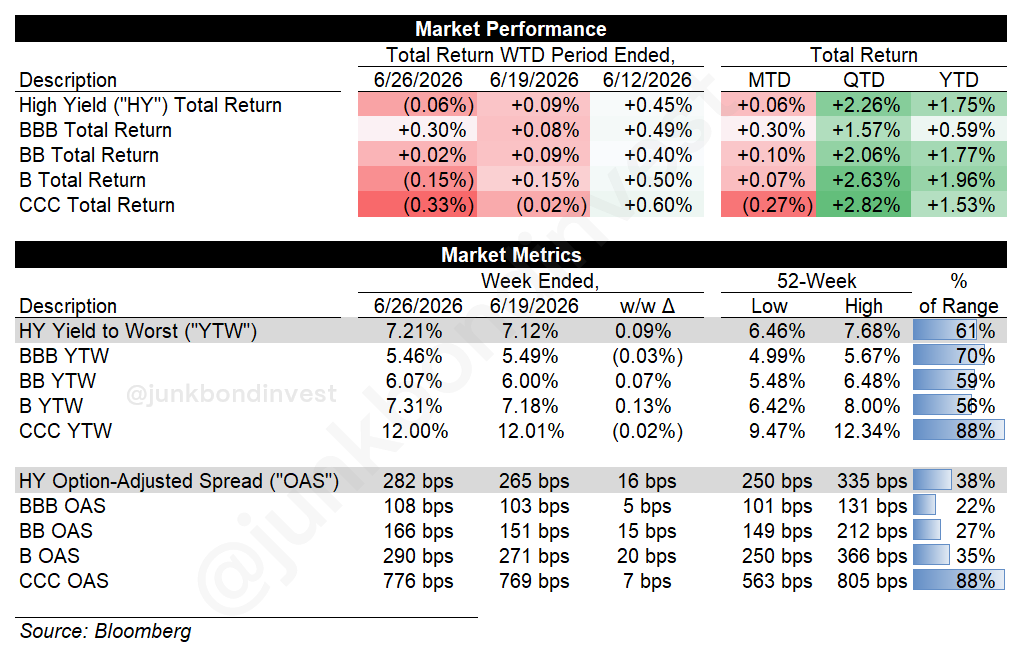
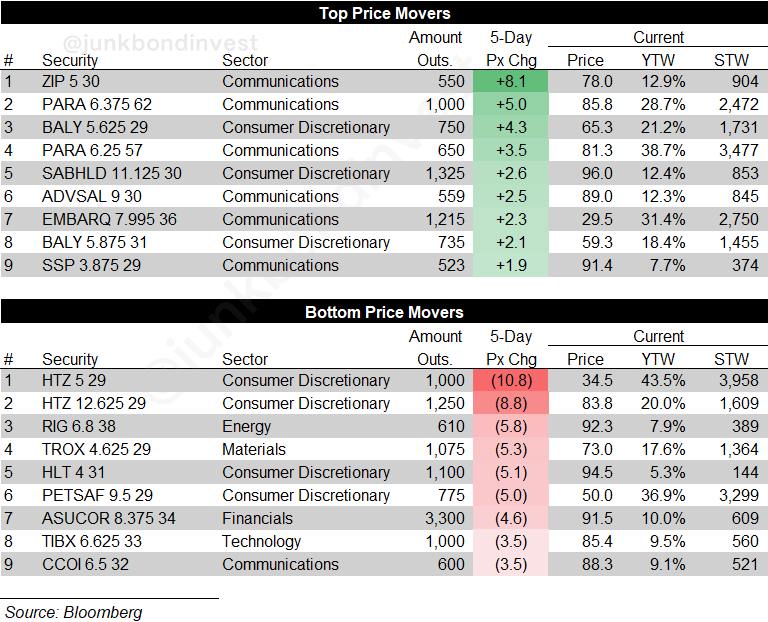
High Yield Weekly Market Performance
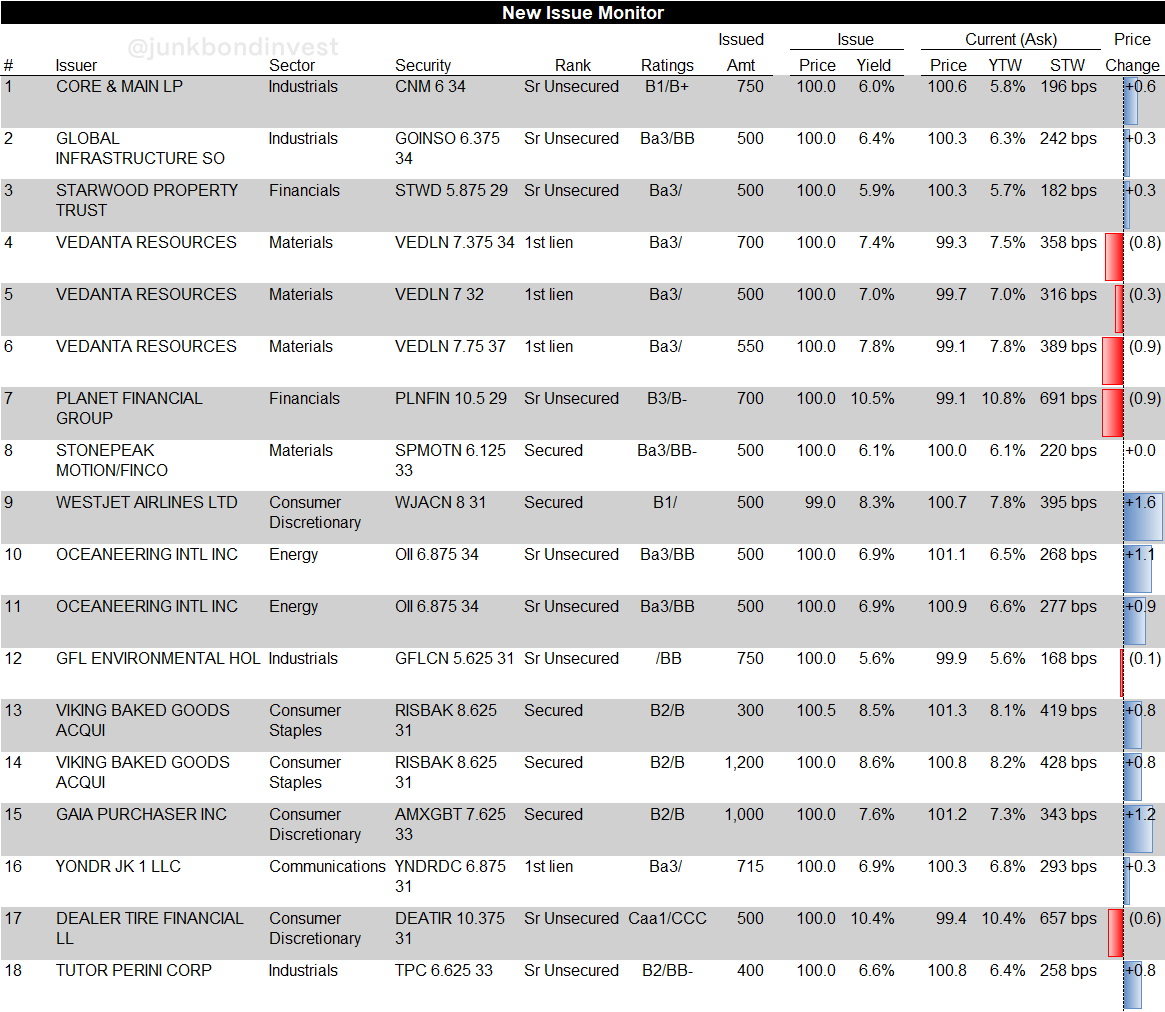
High Yield Primary Market
High Yield Secondary Market
JBI Bulletin Board

1) Something New is Coming
The institutional version of JunkBondInvestor is coming. The list gets in first and locks the founding rate before it closes. Add your name here.

2) Now Hiring: Credit Analysts
I’m hiring credit analysts to add capacity. If that’s you, or someone you’d vouch for, reply with a short note on your background.


