

High Yield Market Weekly Minutes: CCCs Rip Higher as 2026 Kicks Off (January 11, 2026)
Record Issuance, 52-Week Tights, and Nobody's Nervous
🚨 Connect: Twitter | Instagram | Reddit | YouTube | Jobs
Note: Starting January 15, 2026, subscription prices will be increasing. Anyone who subscribes before then will be locked into today’s pricing indefinitely.
TL;DR
High yield gained 0.39% in the first week of 2026. CCCs outperformed at 0.70%. Index spreads narrowed 11bps to 257bps, yields fell 10bps to 6.47%. Primary volume hit $9.4 billion, nearly triple last year’s opening week. December payrolls disappointed at 50K, but unemployment at 4.4% keeps the Fed patient. January hold looks certain; March cut odds improved.
New year, same story: investors cannot get enough paper.
High yield opened 2026 by absorbing over $9 billion of supply, the largest first full week in six years. Spreads compressed to 52-week tights. Yields dropped to 6.47%. Every sector finished green. Charter went out 10 years at par. Calumet printed a straight CCC with OID. Iran protests entered their third week with threats against US military bases, and credit did not blink.
The demand showed up exactly where you would expect in a risk-on tape. CCC paper returned 0.70%, more than double the 0.31% from BBs. Four deals carried at least one CCC rating. When a Caa2/CCC+ issuer can bring paper with OID and trade up 3 points, risk appetite is not the question.
Labor offered a counterpoint. December payrolls printed 50K, capping 2025 as the weakest year for job growth since the pandemic. Prior months revised down 76K. But unemployment at 4.4% gives the Fed cover to stay patient. The market now prices just two cuts for 2026, with the first in June.
Something new is coming.
Built for people who actually care about credit. If you want a first look before it opens up, join the early access list.
Weekly Performance Recap
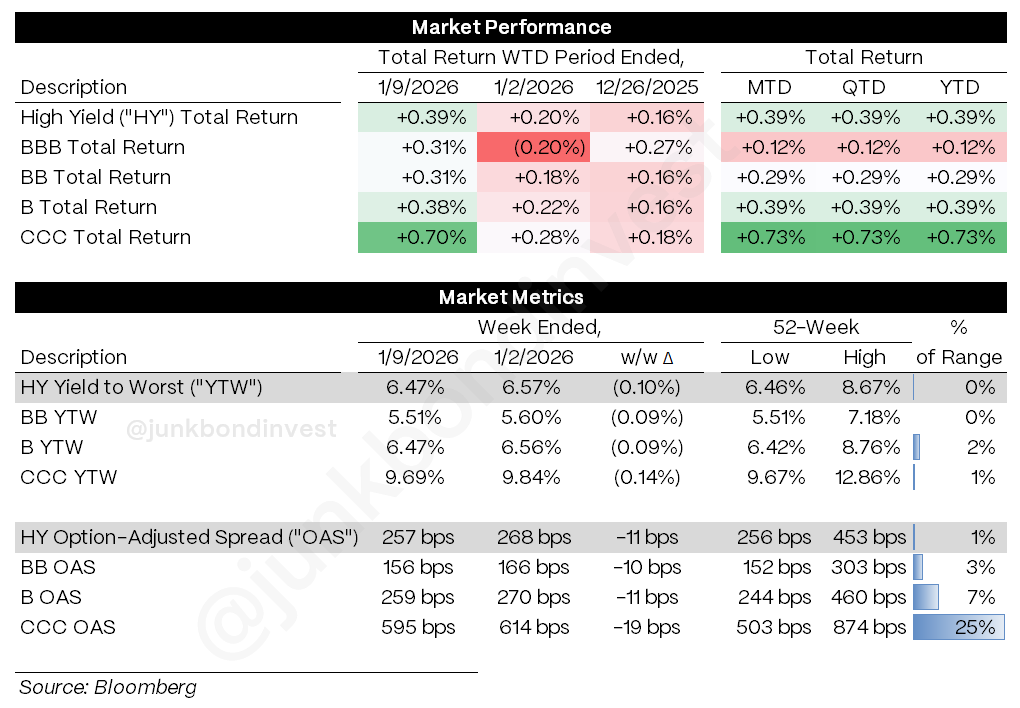
CCCs led at +0.70%, more than double BBs at +0.31%. Spreads and yields both sit at 52-week tights. Flows turned positive. The quality rotation and compressed valuations tell the same story: risk appetite is not the constraint.
Primary Market Activity
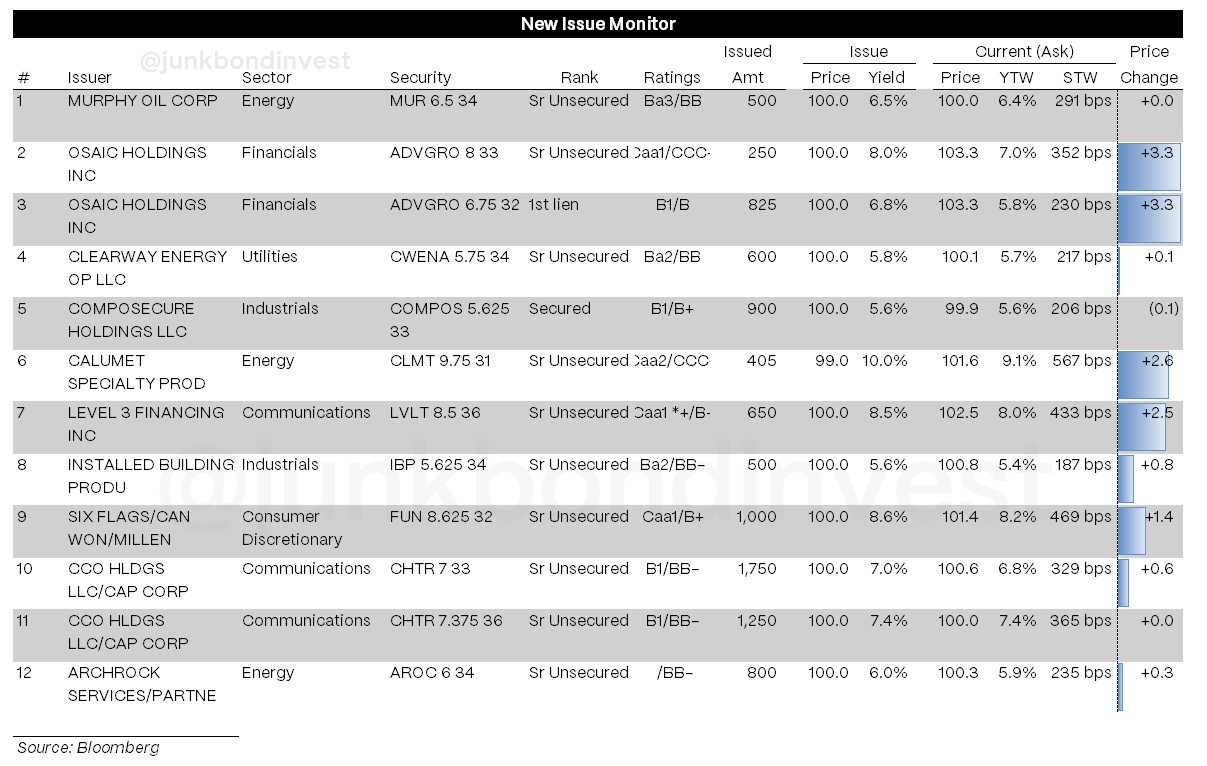
If there was any doubt about risk appetite, the primary calendar cleared it up. Volume hit $9.4 billion across 10 deals, the biggest opening week in six years. 2025 ended roughly 15% ahead of 2024, and 2026 is expected to be larger still. All deals priced ahead of Friday’s jobs report, and the market did not flinch at the soft print.
The mix skewed lower in quality but also showed reach for duration. Four tranches carried at least one CCC rating. Charter going out 10 years at par was a signal; that kind of duration demand does not appear in cautious markets. Coupons ranged from mid-5s on secured paper to 10% on straight CCC risk.
Execution was strong. Charter upsized to $3 billion, with the 7NC3 at 7.00% and the 10NC5 at 7.375%, both at par and tight of talk. Six Flags cleared at 8.625%, inside 8.75-9.00% guidance. Murphy Oil came at 6.50% in line with talk.
Tight BB paper left less room for secondary gains, trading within a half point of par. The lower-rated deals ripped. When CCC paper upsizes through guidance in the first week of January, the bid is real.
Secondary Market
The tape started the year firm despite a fragile geopolitical backdrop. Investors focused on dovish economic data and refinancing supply rather than Iran headlines.
Compression was broad. All 20 HY sectors finished tighter. Chemicals, Consumer Products, and Paper and Packaging each narrowed 20 bps or more. The Russell 2000 jumped 4.6% while the S&P gained 1.6% and hit new highs, and that small-cap leadership showed up in credit as CCCs outperformed BBs by 40bps.
Policy headlines drove pockets of volatility. Housing-exposed names sold off after the White House announced plans to restrict institutional buyers of single-family homes. Media credits swung on M&A noise. Defense traded sideways on proposed restrictions to shareholder returns. Mortgage spreads snapped tighter after the GSEs announced $200 billion of MBS purchases.
Consumer affordability is clearly the 2026 theme. Housing, mortgages, credit cards, oil, all getting White House attention. Whether rhetoric becomes policy remains to be seen, but sector dispersion is picking up even as the index grinds tighter.
Looking Ahead
Fundamentals and technicals are telling different stories.
December payrolls printed 50K with 76K of negative revisions, capping 2025 as the weakest year for job growth since the pandemic. Cyclical hiring has been negative for three straight months. Yet spreads sit 1 bp off 52-week tights and CCC paper is upsizing through guidance.
Fed expectations have shifted hawkish. The market now prices two cuts for 2026 with the first in June, a meaningful repricing from a month ago. January 28 is a non-event. The debate is whether cuts resume at all if inflation proves sticky.
CPI Tuesday and PPI Wednesday will test that thesis. November data was distorted by the shutdown; December should normalize higher. Consensus expects headline CPI at 0.35% and core at 0.36%. A hot print pushes the first cut past June. A soft print probably changes nothing given Fed caution. Bank earnings kick off the same week, with JPM, Goldman, Morgan Stanley, Citi, Wells, and BofA all reporting. Credit quality trends and consumer loss curves will matter more than headlines.
The technical picture is however strong. Flows are positive, supply is being absorbed, the S&P hit new highs Friday. For what it is worth, the S&P’s first five trading days have predicted full-year direction in six of the last seven years.
But valuations leave no margin for error. CCC spreads at 595bps offer roughly 340bps over Bs. That is thin cushion for the worst balance sheets in the index. The White House is laser-focused on affordability heading into midterms, and if any of the headline policies become law, credit implications are real.
The path of least resistance is tighter spreads and modest returns. It will stay that way until something breaks.
Find the most recent JunkBondInvestor posts below


Disclosure: The information provided is based on publicly available information and is for informational purposes only. While every effort has been made to ensure the accuracy of the information, the author cannot guarantee its completeness or reliability. This content should not be considered investment advice. Any investment decisions made based on the information provided are at your own risk. It is essential to conduct your own research and consult a qualified financial advisor before making any investment decisions. Investing involves risks, and past performance is not indicative of future results. By using this information, you acknowledge that you are responsible for your own decisions and release the author from any liability. Always seek professional advice tailored to your financial situation and objectives.