

Credit Weekly: The CapEx Cycle Always Ends The Same Way
What the 1990s capex cycle actually tells you about AI infrastructure debt

$2.25 trillion. That’s where IG gross supply is tracking this year according to Morgan Stanley. Up 25% from last year. Q1 alone printed $1 trillion against $600 billion the same quarter last year.

AI related issuance specifically is on pace for $400 billion. Last year it was $150 billion. Hyperscalers alone account for $250 to $300 billion of that. Then the data center REITs. First time issuers getting pulled in. Industrials and utilities that have to spend more because the hyperscalers are spending more.
This isn’t a one year thing. Hyperscaler capex is tracking above $700 billion this year and projected above $900 billion next. Three trillion cumulative through 2028, and that’s not a terminal number. The models need continuous training. The infrastructure needs continuous build out.
A multi year supply event. And the way its implications on credit markets are being framed is wrong.
The Emerging View
Start with what’s not in dispute. Hyperscaler credit quality is fine. These are companies generating hundreds of billions in annual free cash flow, sitting on massive cash balances, and operating at investment grade ratings that would survive even a substantial increase in debt. $400 to $500 billion of issuance without a downgrade is well inside their capacity. The bull case is fine on its own terms.
The spread-widening case is more mechanical. IG bond supply overwhelms demand. The sheer volume of new paper hitting the market forces spreads wider regardless of fundamentals. Concessions widen at the margin. Crossover buyers pull back. The marginal buyer needs a better entry point. IG resets wider and the technical clears. HY follows through the curve.
It sounds clean. The 1990s data doesn’t support the mechanical version of it.
The 90s Were Not a Supply Story
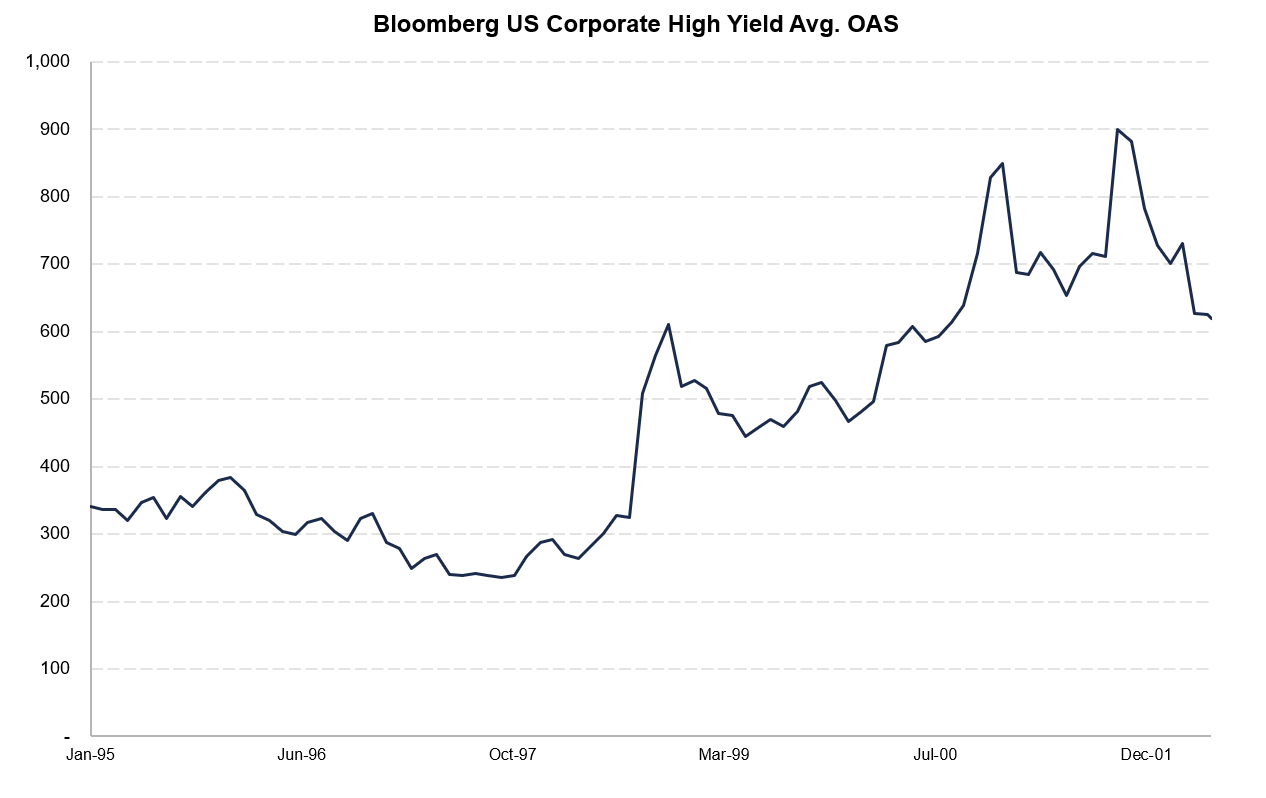
The last comparable capex super cycle was telecom and fiber buildout in the mid to late 1990s. Different technology, same structural dynamic. Massive infrastructure investment, credit writing the check, equity markets rewarding the spending. Telecom capex peaked at $220 billion in real terms in 2000. AI capex passed that level last year and the curve is still steepening. Bigger version of the same shape. Faster too.

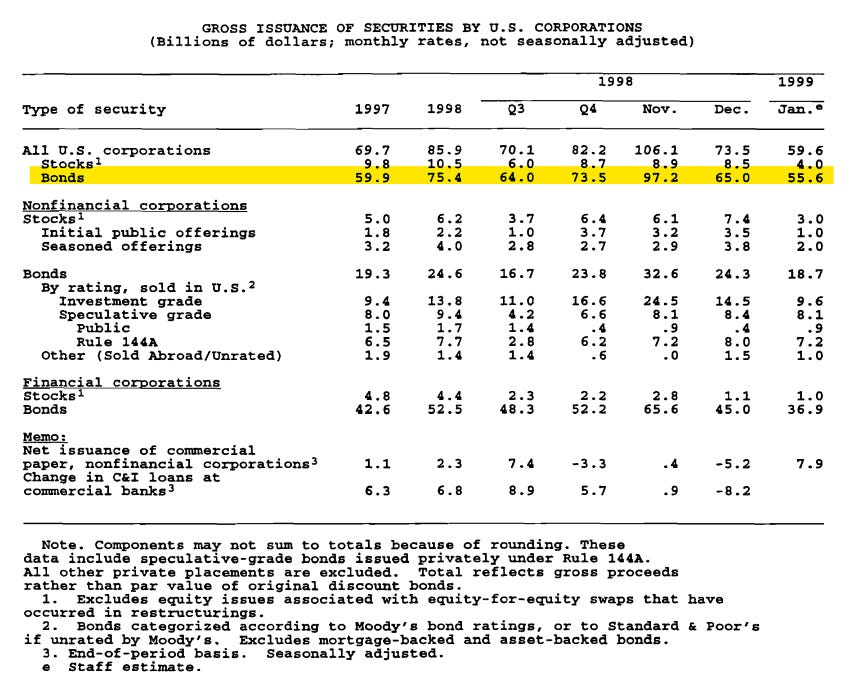
Corporate bond issuance grew through the prior cycle. Fed Greenbook data has it at a $59.9 billion monthly rate in 1997 and $75.4 billion in 1998. November 1998 alone printed $97.2 billion, the biggest supply month of the cycle landing in the middle of the post-LTCM repricing.
Spreads widened modestly in 1997 and meaningfully in 1998. The macro otherwise looked constructive. GDP growth was fine. Earnings were fine. M&A was active. The stock market was working.
When the Fed wrote its 1999 Monetary Policy Report to Congress documenting what actually drove those moves, supply absorption from the capex cycle wasn’t on the list. The Fed cited three drivers: liquidity concerns, Y2K, expected Fed tightening. The proximate triggers were Asia in 1997, Russia and LTCM in 1998.
Supply was not the proximate cause. But the capex-funded issuance wave wasn’t irrelevant either. It changed the market’s starting condition. It left credit markets carrying more leverage, more issuer concentration, and less absorption capacity for when the shocks did arrive.
That’s the distinction worth holding onto. Supply doesn’t widen spreads mechanically. It builds the vulnerability that determines what happens when something else does the widening.
How Supply Pressure Actually Moves Through the System
The fragility moved through specific channels. The bank channel was the big one.
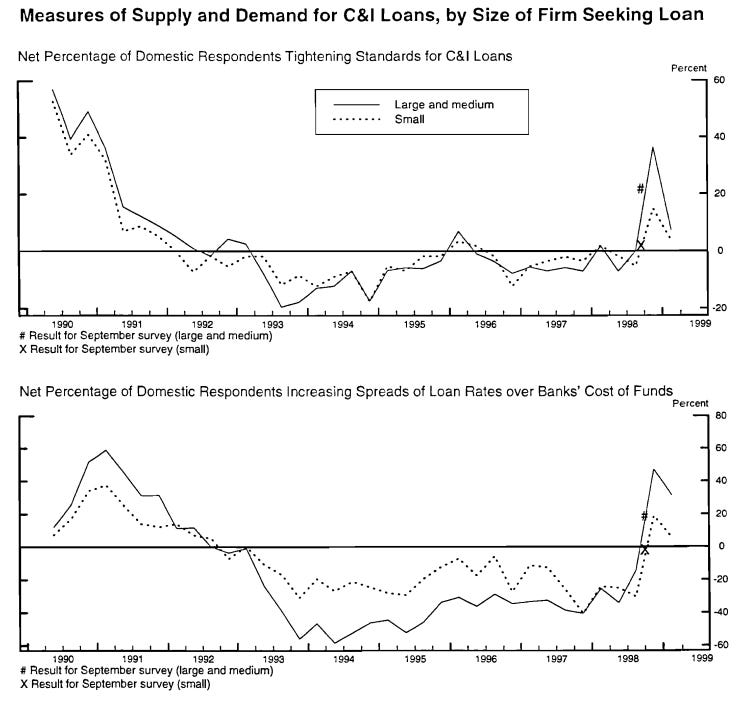
By January 1999, the Fed’s Senior Loan Officer Survey was reporting that conditions in the syndicated loan market still hadn’t recovered from the previous fall. Banks tightening terms. Spreads on loan rates over banks’ cost of funds went from negative 40 percent net respondents to positive 40 percent in a single quarter. Largest move on the chart in nearly a decade.
The Fed staff documented the mechanism in real time:
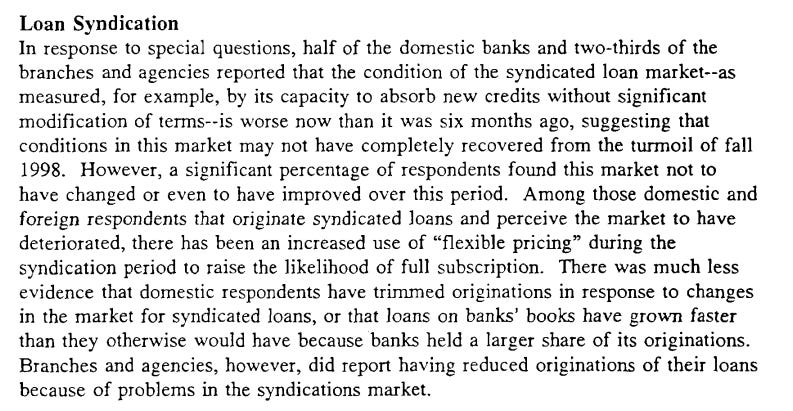
Concessions widened to clear deals. Same dynamic the emerging view is flagging today on AI deals. Wider pricing to clear paper that used to clear flat. Happening in early 1999 in the syndicated loan market.
This is where the supply story has real bite. Not at the index level, where the proximate catalysts dominate. At the absorption layer, where the channels doing the absorbing get stressed. Capex supply doesn’t widen index spreads. It strains the plumbing.
What Was Tightening While Everything Else Repriced
Here’s what cuts against the simple supply-widens-spreads thesis even more directly.
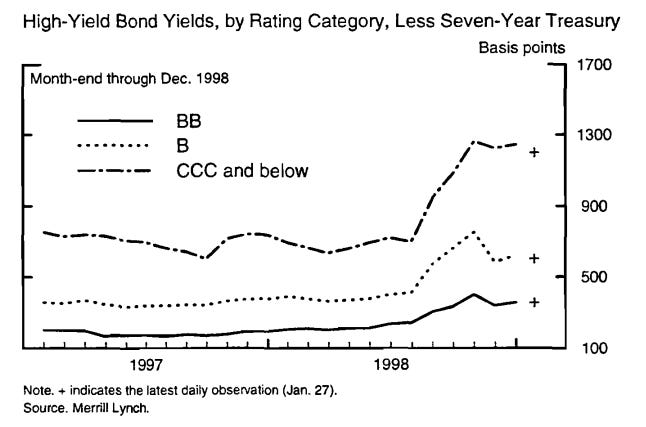
Wider IG spreads. Tighter bank standards. Deteriorated syndicated loan market. And the Fed staff observed that lower quality HY was actually tightening in December 1998:
More supply. Lower quality. Tighter spreads. The bid showed up at the lowest quality cohort right when the rest of the market was repricing. Composition shifted away from telecom toward broader B-/below issuance.
The Fed saw it. The market kept buying.
That’s late 1998. The real HY damage came later, after the fragility had already been built. The 1999 default rate hit levels not seen since the 1990-91 recession. GDP growing above 4 percent. Unemployment at 30 year lows. The macro looked fine.

Default cycle was already underway in HY two years before the broader spread peak in 2001-02. The fragility wasn’t sitting dormant waiting for an external catalyst. It was manifesting in the lowest quality cohort first. Capex supply didn’t cause those defaults directly. But the issuance wave had brought a lot of marginal credits to market with thin margin for error. When the cycle turned, that’s where it turned first.
Catalysts arrived later and generalized the cracks. The cracks were visible early if you were looking at the right cohort.
The 1990s gets pulled out as the analog for what supply does to spreads. The mechanism is more complicated than that. Supply mattered, but not as the single mechanical cause. It built the vulnerability. The catalysts did the damage.
Where the Analog Lives Today
AI infra paper is increasingly finding its way into HY. CoreWeave issuing across the curve. Crypto miners starting to tap the market. HPC operators that aren’t IG ending up here. Pace has accelerated meaningfully over the last six months.
Not yet a dominant share. Data center exposure is under 2% of the index. The supply pressure accumulating in IG hyperscaler issuance hasn’t reached HY at the same scale.
HY isn’t insulated from what happens in IG either way. HY prices off the IG curve plus a risk premium. When IG widens for any reason, the all-in yield on IG goes up, crossover buyers reaching into HY for yield pull back into higher quality, and HY loses its marginal buyer. Beta is the other channel. HY has more spread duration. Any market wide repricing of credit risk hits HY harder in absolute terms even when the catalyst sat in IG.
That’s transmission one. Transmission two is more specific to the cohort itself.
The AI infrastructure paper in HY is being priced as if hyperscaler capex is a structural feature of the economy rather than a cyclical bet on a specific technology paradigm. Bonds clear inside guidance. Spreads compress. Issuance accelerates. The underlying demand assumption, that Microsoft and Meta and Amazon and Google will honor multi year power and capacity contracts at current pricing, gets treated as a given rather than a probability.
It’s not a given. It’s a probability. The cohort is pricing it like the former.
The cohort that defaulted first in 1999 wasn’t AT&T and Sprint. It was the CLECs, the fiber builders, the marginal issuers being priced as if the demand story was resolved. Headline indices stayed range bound while the lowest quality cohort cracked.
Small cohort relative to the index. Also exactly where the analog says to look first.
What the Cohort Looks Like Up Close
The cohort isn’t a hypothetical. The cleanest example is sitting on the tape right now.
CoreWeave is one of the most actively traded HY bonds. The 9.25% 2030s rose more than a point last week on news of another funding round, this time in the loan market.
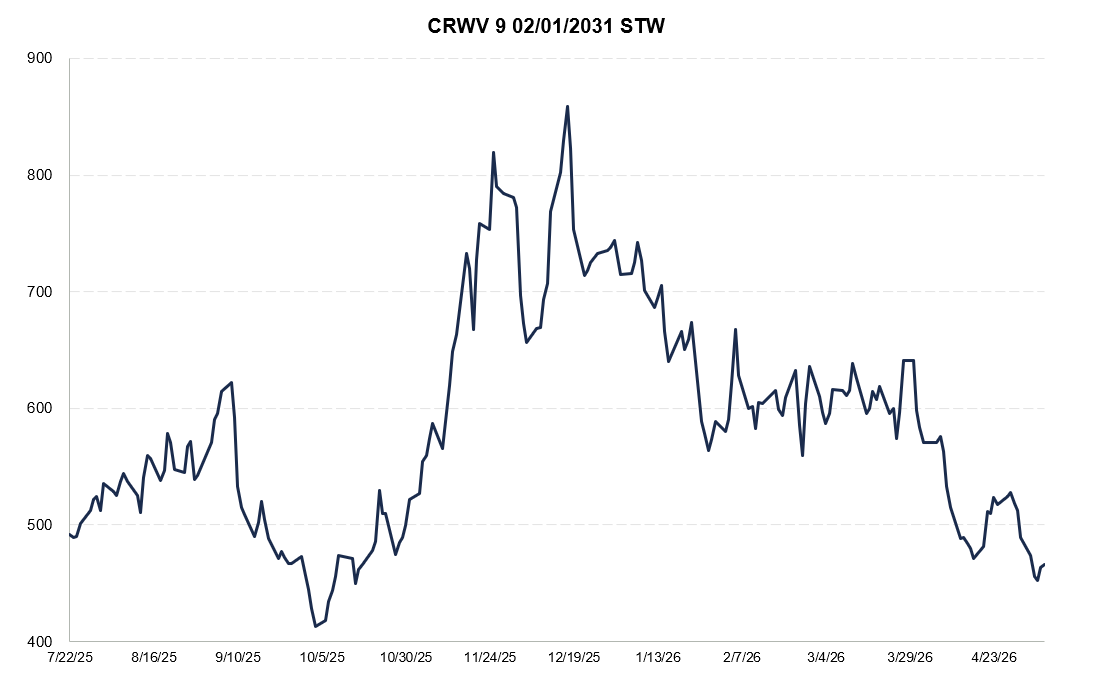
Equity, HY bonds, levered loans, GPU backed financings, private debt. The capital stack is complex enough that recovery analysis in any stress scenario depends on which collateral package gets which GPUs at which utilization rates.
The simple version is a neocloud renting GPUs to enterprises. The actual underwriting is more layered. You’re long the assumption that
GPU depreciation schedules reflect economic reality.
Hyperscaler capex stays directional and doesn’t shift toward insourcing.
New chip generations don’t compress the useful economic life of existing fleets faster than the bond term.
Demand for neocloud capacity persists at margins that service the debt.
Each of those is debatable. None of them is being debated in the spread. The bonds continue to trade tighter implying the credit story is getting resolved.
That’s the pattern the late 1990s analog points to. Marginal infrastructure issuers being priced as if the demand story is resolved, in capital structures that depend on assumptions the spread isn’t testing. The shape is familiar even where the specifics differ.
The Inflation Tail Not Being Discussed
The capex cycle isn’t happening in a vacuum. It’s happening in a macro setup that’s been quietly building its own vulnerability.
Financial conditions are easier than they were pre-conflict despite oil 50 percent higher and one year inflation swaps trading 75 bps higher, implying headline around 3.2%. The market is pricing more growth and more inflation simultaneously and treating it as benign.
Labor stabilizing into the same impulse. NFP printed 115k after 185k. Initial claims four week average at 203k. JOLTS quits at 2%. None of this looks like an economy rolling over.
Reduced immigration on top of a tightening labor market raises the odds of second round core inflation from the headline oil shock. Wages are the transmission channel. The Fed isn’t pushing back.
If the inflation impulse from the war translates into stickier core through wages, the long duration universe is the wrong place to be sitting. Sector tape was already telling you this last week. Basic Industry, Other Industrial, and Consumer Cyclical led for the month. Communications and Transportation lagged.
The reflation trade is starting to leak through into credit. Most accounts haven’t repositioned for it.
What the Week Said
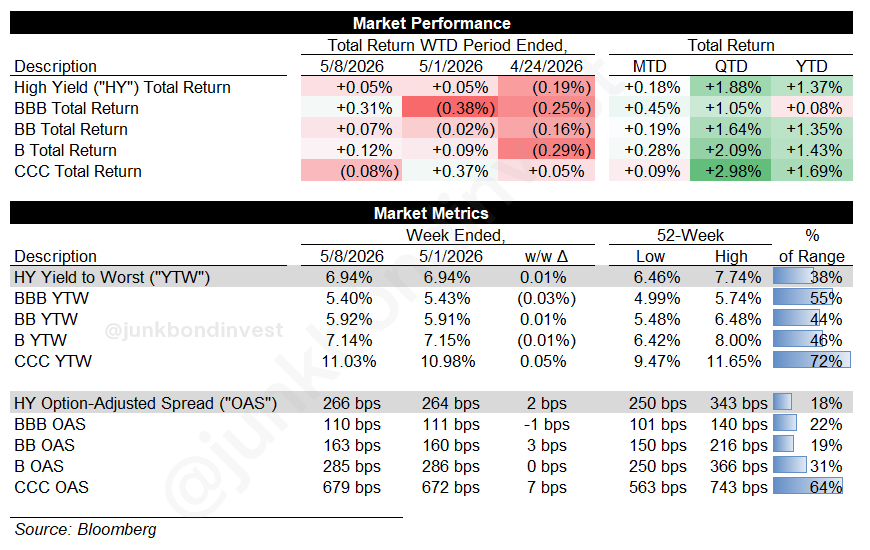
HY finished up 0.05%. Equities at all time highs. OAS on the index closed at 266 bps, tightest since January. Yields tightened five basis points to 6.94%. Iran de-escalation, a strong NFP print, and another wave of corporate beats did the heavy lifting.
The primary market did the rest. The busiest week by deal count since May 2024. YTD volume tracking 50%+ ahead of last year. Eight deals cleared on Thursday alone for more than $5 billion. Yahoo brought a $900 million deal at par to yield 11%. Hilton priced $1 billion of 5.5 year notes. Level 3 Financing took down $1 billion to fund a tender.
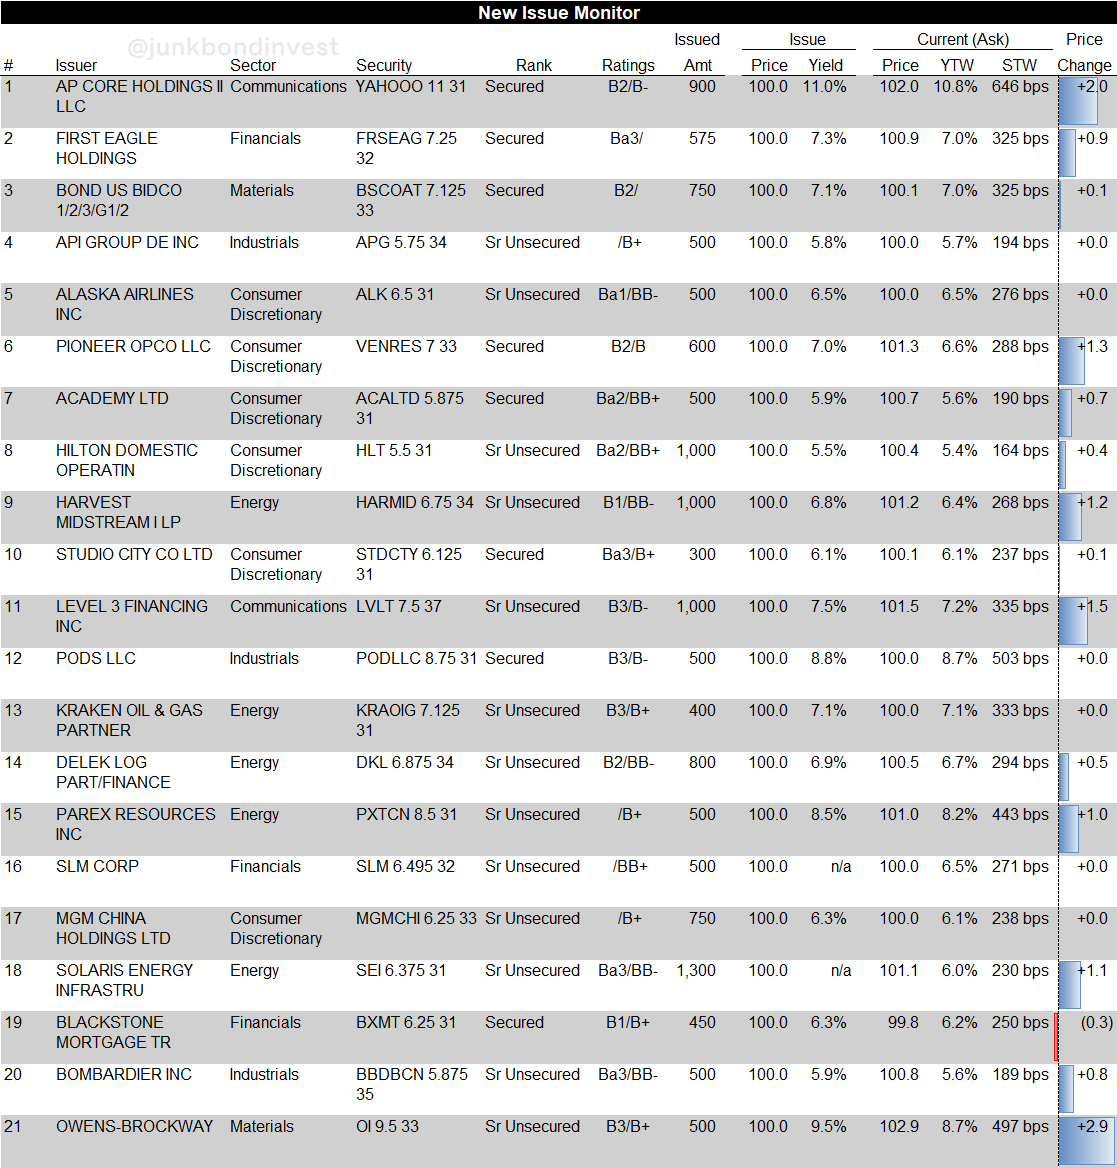
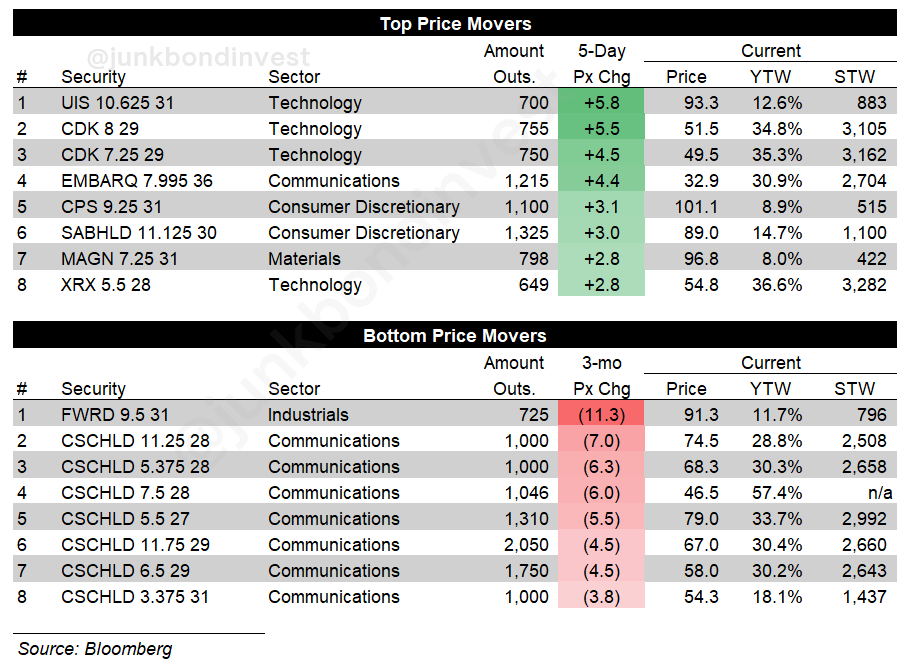
Secondary was orderly. Solaris broke at 101 plus. Sabre gained 4 points on a beat. CoreWeave rose more than a point on news of another funding effort. Forward Air dropped after disclosing it found no viable buyers. Idiosyncratic. Worth flagging because everything else in the tape ran the other direction.
Where This Leaves You
The point isn’t that AI is a bubble. Might be. Might not be. The capex cycle might justify itself with productivity gains that make the depreciation schedules look conservative. Or it might not.
The point is the credit market is now structurally exposed to that question being answered correctly. $400 billion of AI related issuance in IG, growing volumes in HY, trillions more coming over the next three years.
The supply isn’t widening spreads today. It’s not supposed to. It’s building the vulnerability that determines what happens when the catalyst arrives.
Spreads grind tighter while the capex builds. The marginal buyer keeps showing up. The new issue calendar clears. Then something cracks the demand assumption underneath it. A hyperscaler cuts capex. A chip cycle obsoletes existing fleets faster than depreciation. A contract gets renegotiated. The catalyst is usually external. The vulnerability is always the supply that came before it.
The Fed’s contemporaneous data showed junk default rates in 1999 hitting recession era levels with GDP growing above 4 percent. The cracks were visible early. The catalysts came later.
Watch the cohort, not the index. That fragility is being built right now.
JBI Bulletin Board

1) Now Hiring: Distressed Credit Analyst
I’m looking to bring on a dedicated distressed credit analyst. At least a couple of years covering the space, buy-side experience strongly preferred. Ideally software or building products coverage. You should know the names, know the docs, and the playbooks. If you’re interested or know someone who fits, reach out with a brief note on your background.
2) Wharton Online Partnership
Wharton Online and Wall Street Prep have an upcoming Restructuring and Distressed Investing Certificate Program. Starts June 8th. The program covers capital structure, bankruptcy mechanics, and distressed investing, led by practitioners at firms like Silver Point and Ropes & Gray. Code JUNKBOND gets you $300 off, with another $200 off if you enroll by May 11.

3) Endex
I’ve been using Endex for a few months now. It’s an AI agent tool built specifically for excel. The charts in this week’s post were built with it. The model traces every cell back to source so I can audit the work later. If you spend any real time in Excel building models or pulling data, it’s worth a look.


Great article - restacked.
Michael Burry writes extensively on the AI bubble. This article has really helped me grasp the narrative from a credit perspective. Thank you!