

FS KKR Capital Corp ($FSK): Are the Bonds Cheap Here?
Why FSK's bonds tell a different story than its equity
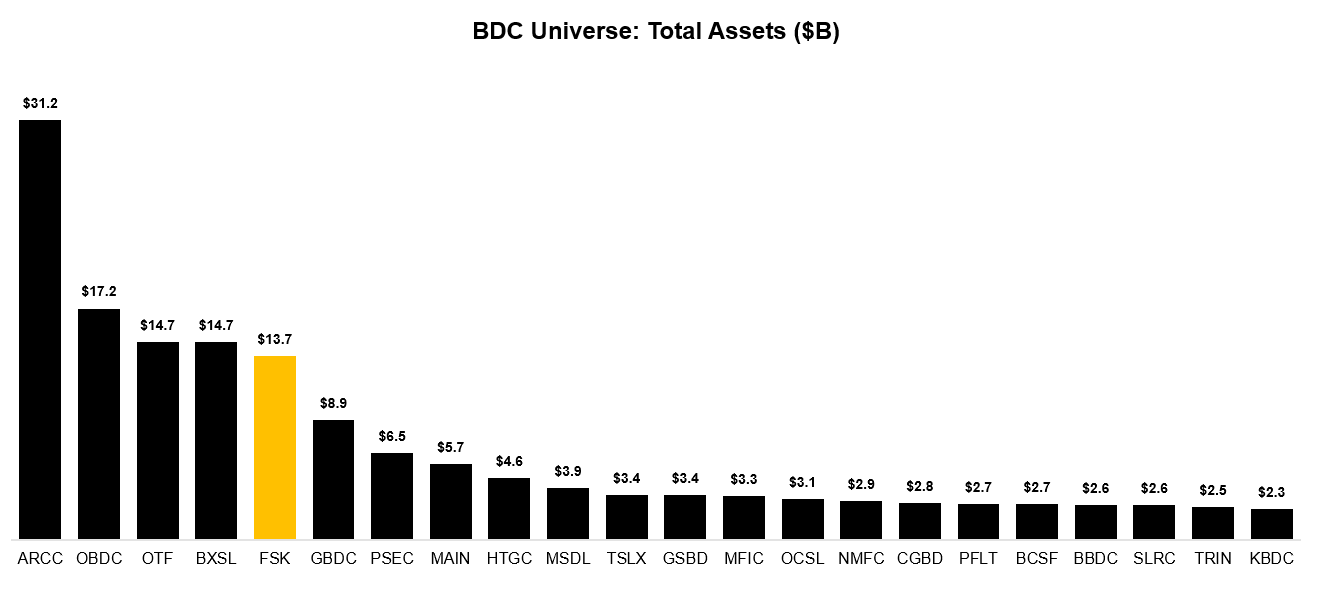
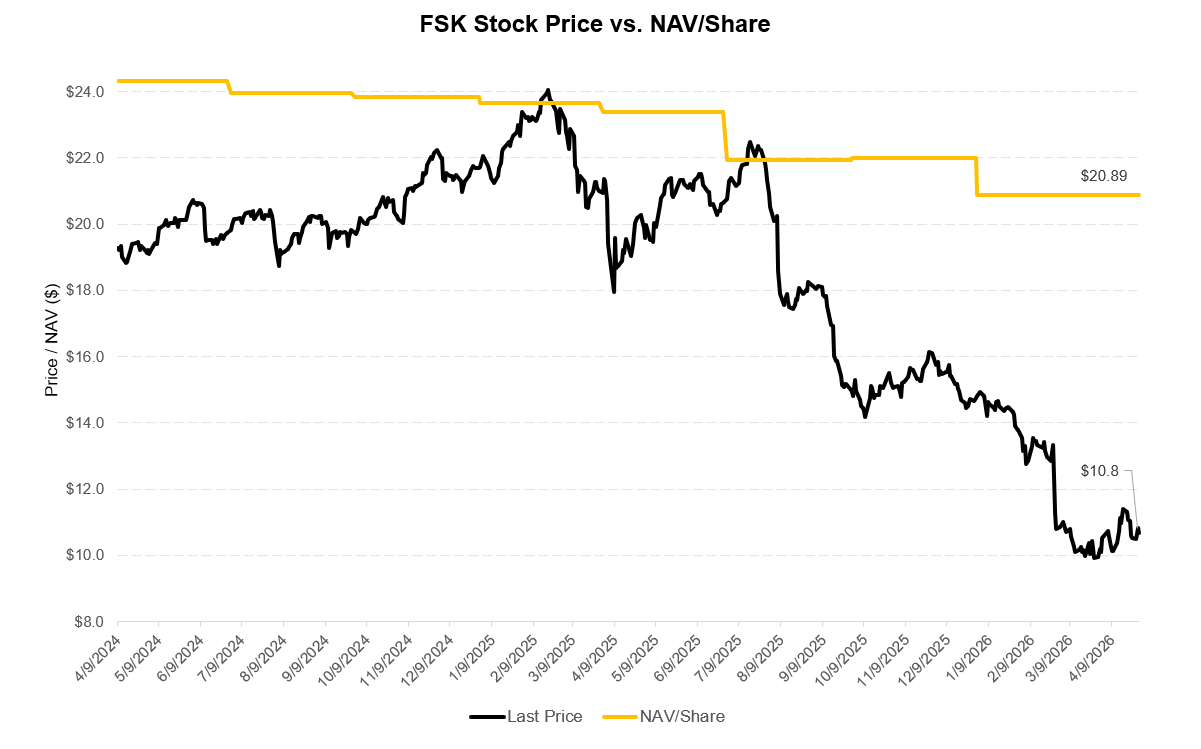
FSK is one of the largest BDCs in the market. $13 billion of private credit, 232 portfolio companies, externally managed by KKR. The stock trades at a 50% discount to book.
The realized losses keep coming, quarter after quarter. The equity market has decided NAV is severely overstated and priced it accordingly.
What about the bonds?
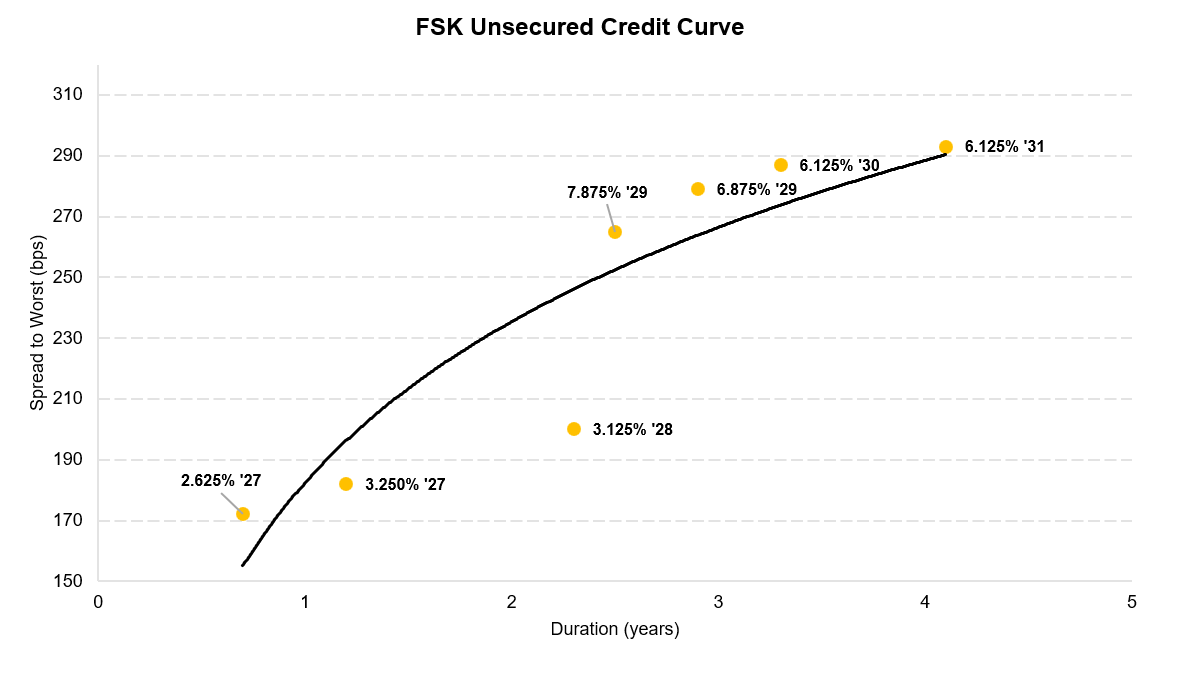
They got downgraded to junk earlier this year. $3.75 billion outstanding across seven tranches, Ba1, sitting above the equity. The 2030 notes yield 6.8% to maturity. That’s 291 bps against a BB index at 164. FSK is trading 120 bps wide of BBs with a portfolio that’s been bleeding realized losses for over a year.
Is that enough?
What’s in the Portfolio
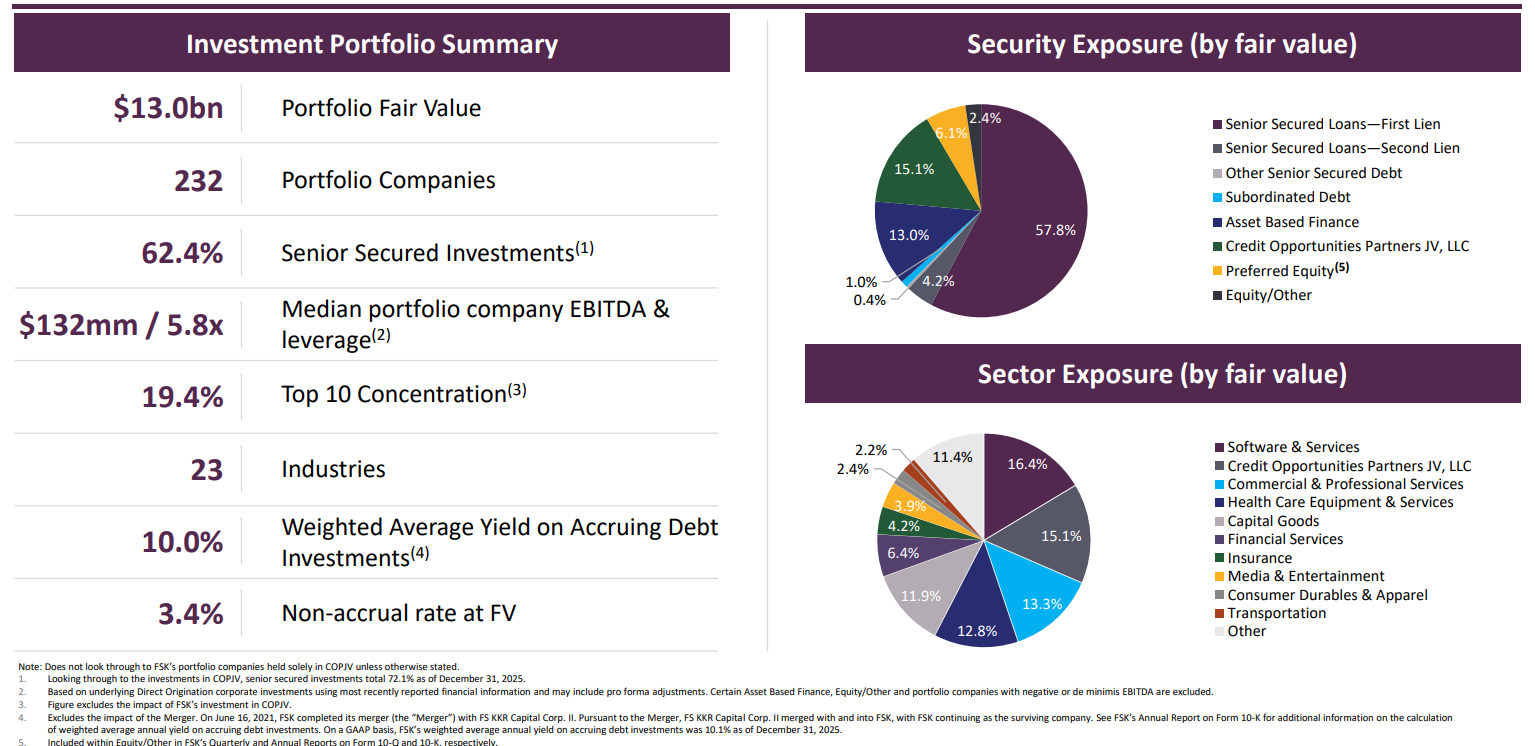
The quick headline numbers:
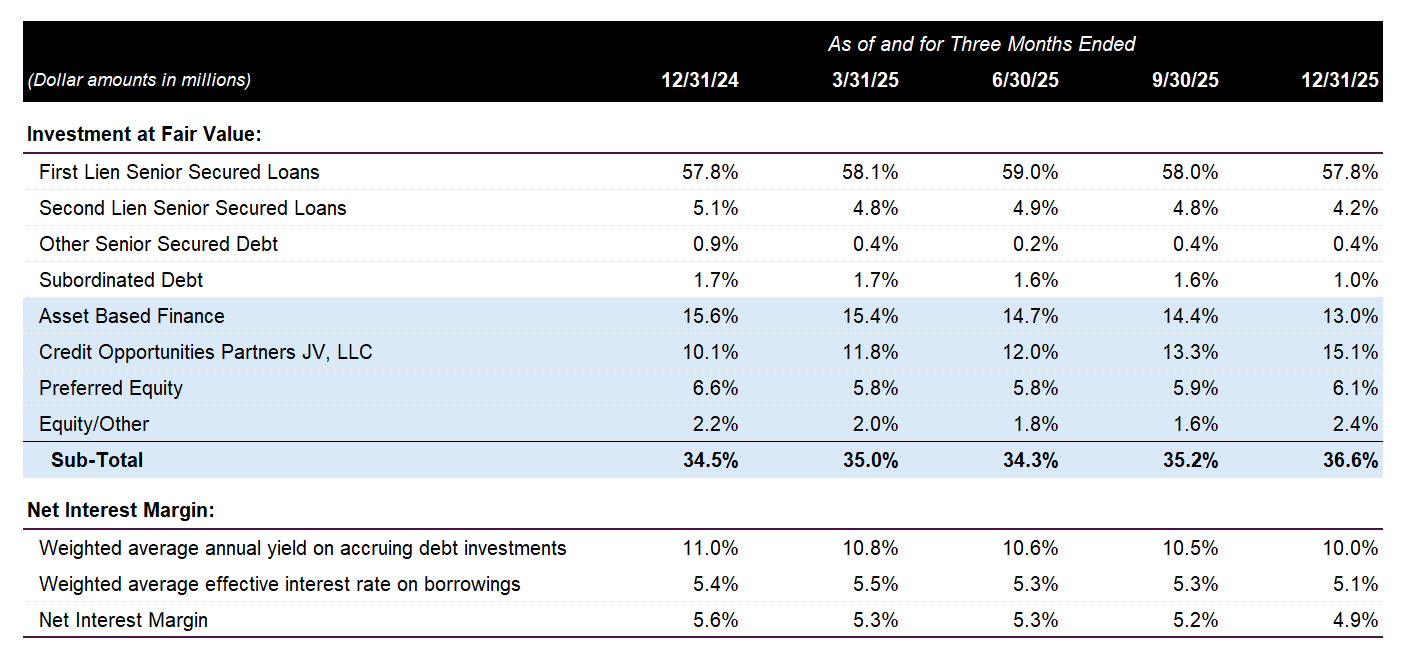
Weighted average yield on accruing debt of 10.0%
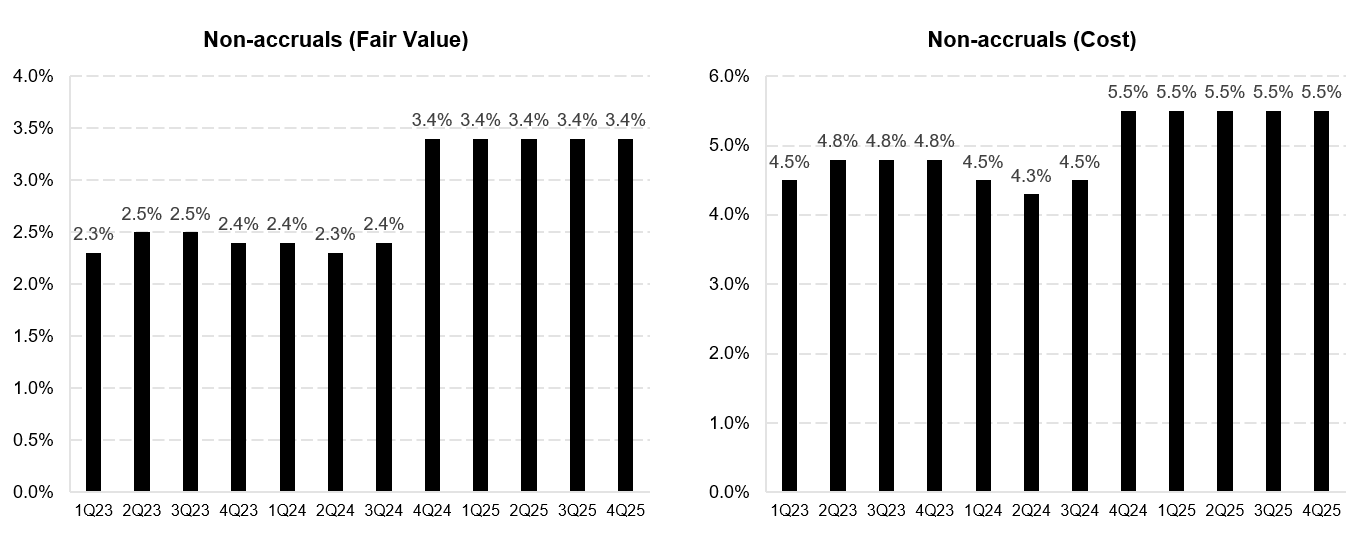
3.4% non-accrual rate at fair value, 5.5% at cost
88% floating rate, top 10 concentration is 19%
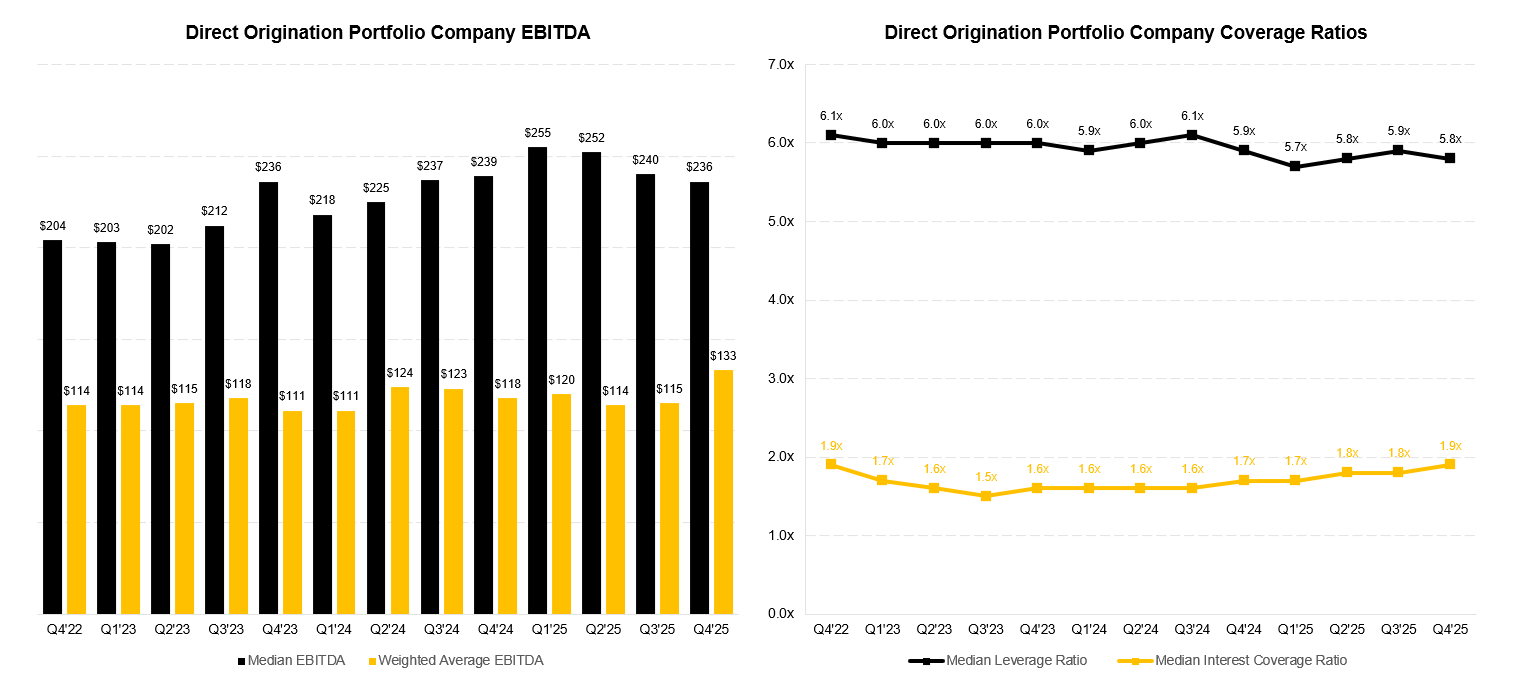
Median portfolio company EBITDA is $132 million at 5.8x leverage
First lien senior secured loans are only 58% of the portfolio. Asset-based finance is 13%. Credit Opportunities Partners JV is 15%. Preferred/common equity is ~9%.
The combination of ABF, COPJV, preferred equity, and equity adds up to 37% of the book. That’s the part of the portfolio where management has more discretion on marks and where the underlying risk is harder to assess from the outside. We’ll come back to COPJV.
The realized loss run rate is pretty atrocious. Five quarters in a row of negative realized losses. That’s $517 million of cash losses on the portfolio over fifteen months, or about $414 million annualized.
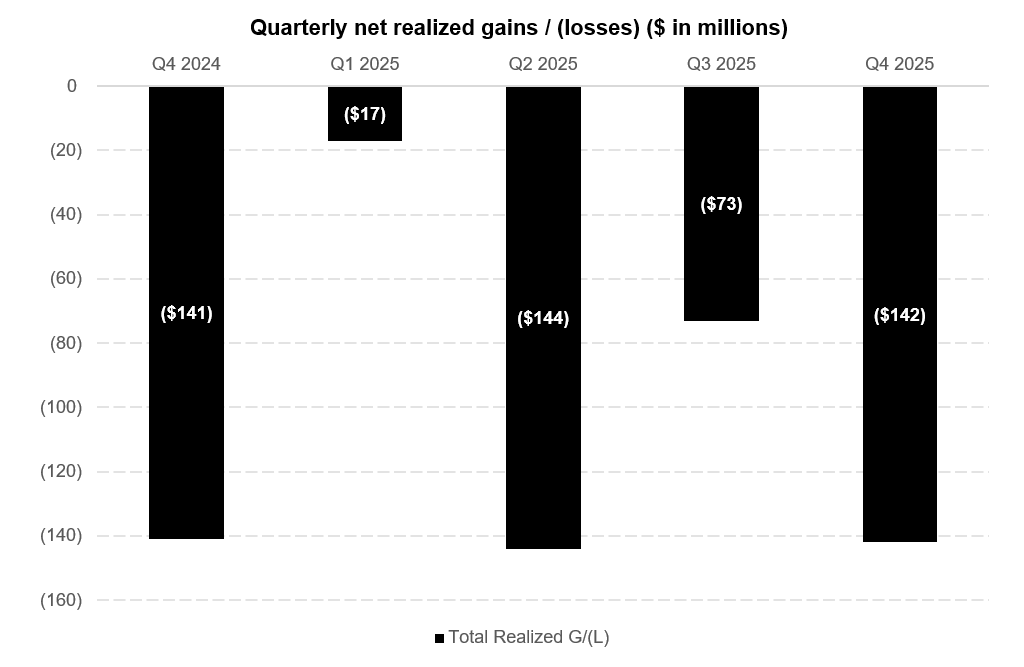
These are not mark-to-market write-downs that bounce back. These are loans being exited at less than par. For context, the entire portfolio is $13 billion, so we’re running at roughly 3.2% of the book in realized losses per year. Elevated compared to the broader BDC peer group and remarkably consistent.
Twenty one positions are on non-accrual. That’s the 3.4% number management quotes at fair value. The biggest are 48forty Solutions ($190 million marked in the 47 cent range), Lionbridge Technologies ($79 million at 85 cents), and Kellermeyer Bergensons ($40 million at 40 cents on the 2L while the 1L sits at par).
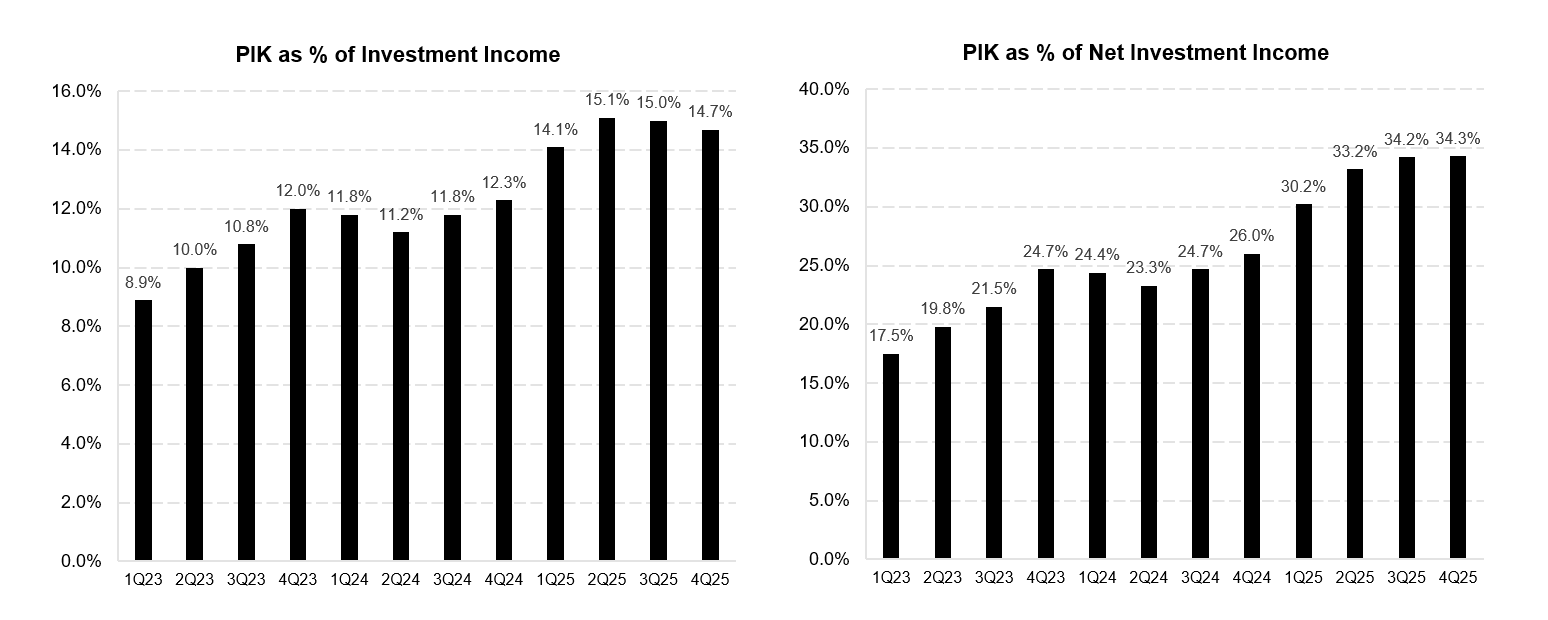
PIK income is running at $55 million per quarter, or about 34% of net investment income. Elevated. PIK accrues but doesn’t generate cash, and a non-trivial percentage historically gets impaired before it converts.
The credit stats on the underlying portfolio companies have been stable to slightly improving. Median EBITDA at $132 million is the highest it’s been since the merger. Median leverage at 5.8x and interest coverage at 1.9x are both fine. The typical loan in the book sits on top of a real business with real cash flow. The problem is the tail, not the median credit.
The Capital Structure
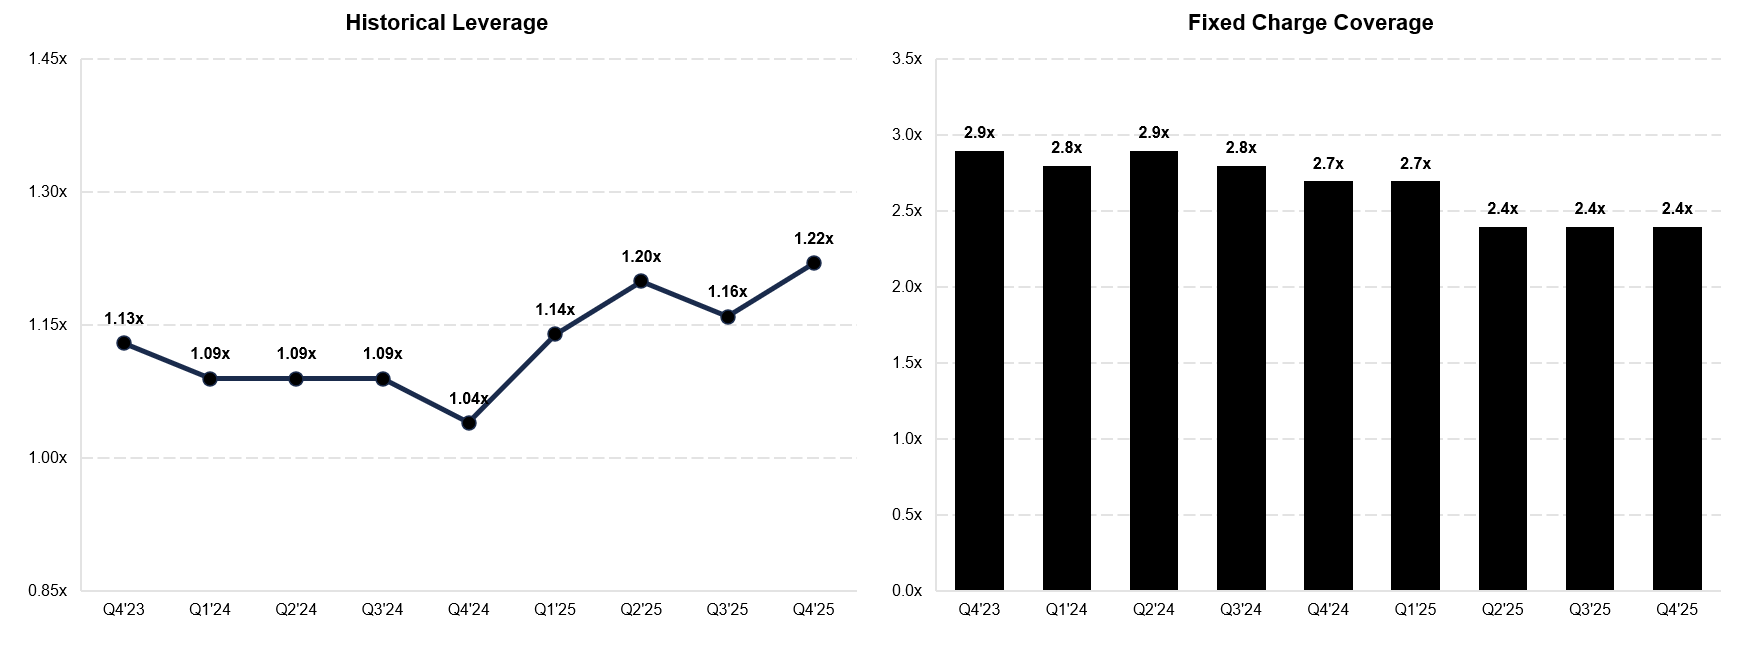
FSK runs ~$7.6 billion of debt against a $13 billion portfolio. Asset coverage is 180% against a regulatory floor of 150%. Net debt to equity is 1.22x, comfortably inside the 2x BDC statutory limit. On the surface, the balance sheet looks fine.
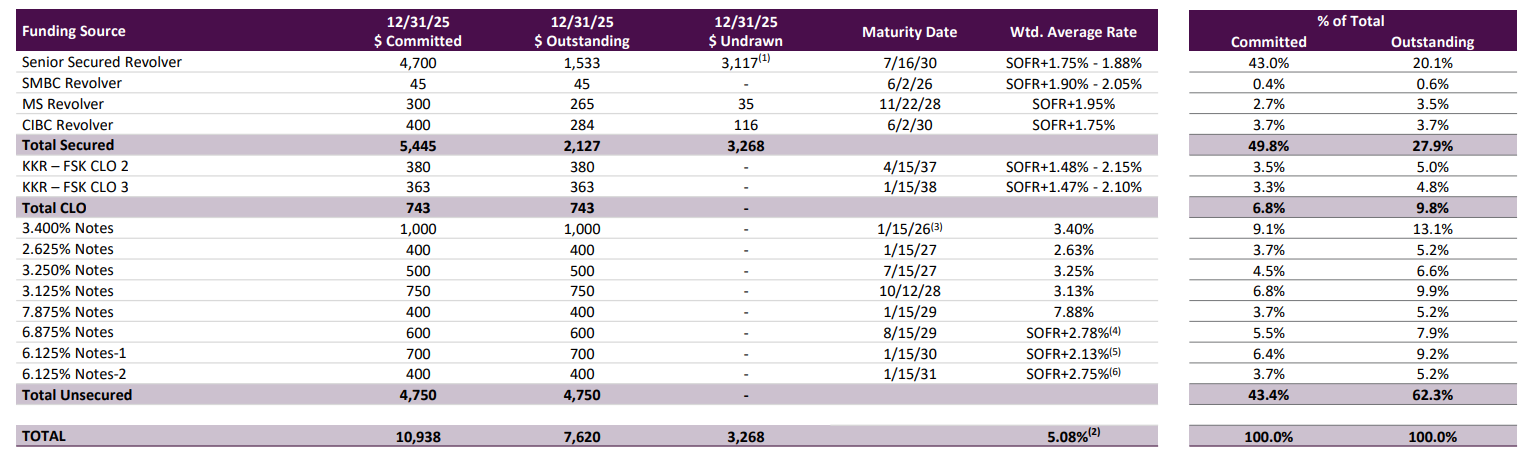
The big piece is the senior secured revolver due July 2030 with $2.53 billion drawn (I assume the ‘26 maturity was paid with a RCF draw) against $4.7 billion committed, priced at S+188bps. There are three smaller bilateral facilities totaling $594 million. Then two CLO tranches totaling $743 million at SOFR+148 to 215. The revolver has $2.2 billion undrawn, which is the company’s emergency liquidity if the bond market closes.
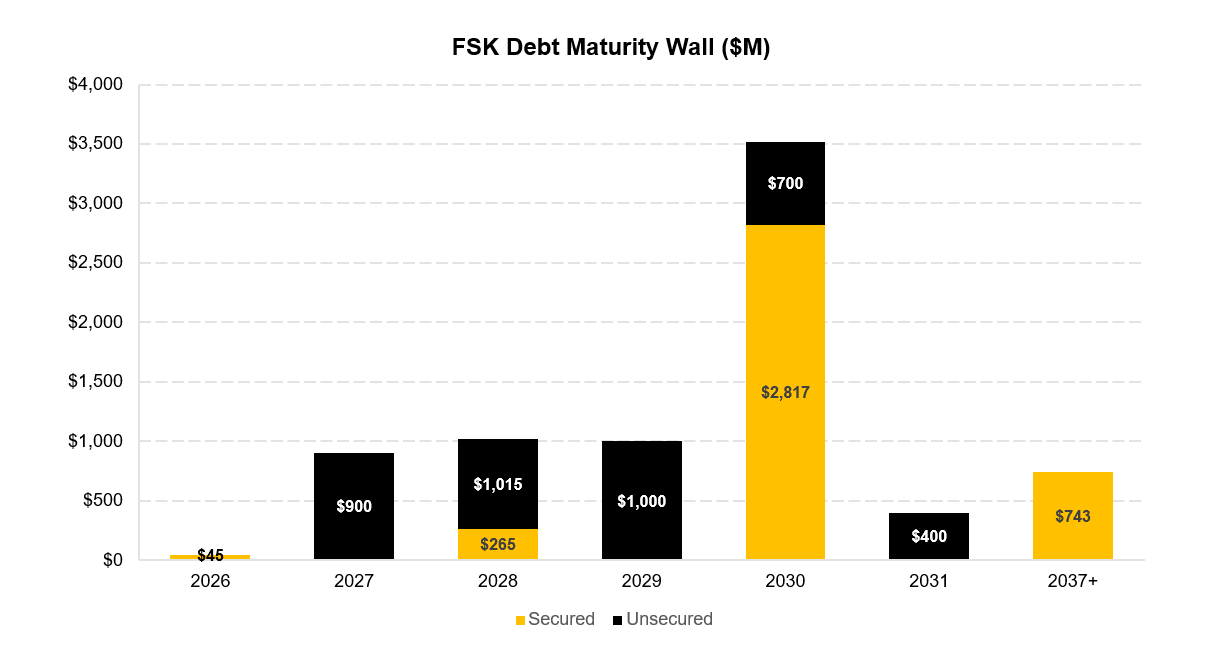
Unsecured bonds are $3.75 billion across seven tranches, all rated Ba1 by Moody’s. Two tranches mature in 2027, $400 million and $500 million, with coupons of 2.625% and 3.250%. Issued during the ZIRP era. They mature in January and July 2027, and they likely have to refinance into the high yield market.
Outside of that, maturities are spread across 2028, 2029, 2030, and 2031, with the secured CLOs running out to 2037 and 2038. There’s no single year where more than a billion of unsecured comes due after 2027. The company has time.
The weighted average effective rate across the entire debt stack is 5.1% as of Q4 2025. That’s down from 5.4% a year earlier, mostly because SOFR has come off and the floating exposure benefits. Annual interest expense is running around $440 million. Against $588 million of adjusted NII annualized, interest is roughly 75% of pre-interest earnings. There’s leverage here, and the leverage works against the company if either NIM compresses further or refinancing costs rise.
Is the Portfolio Worth What They Say?
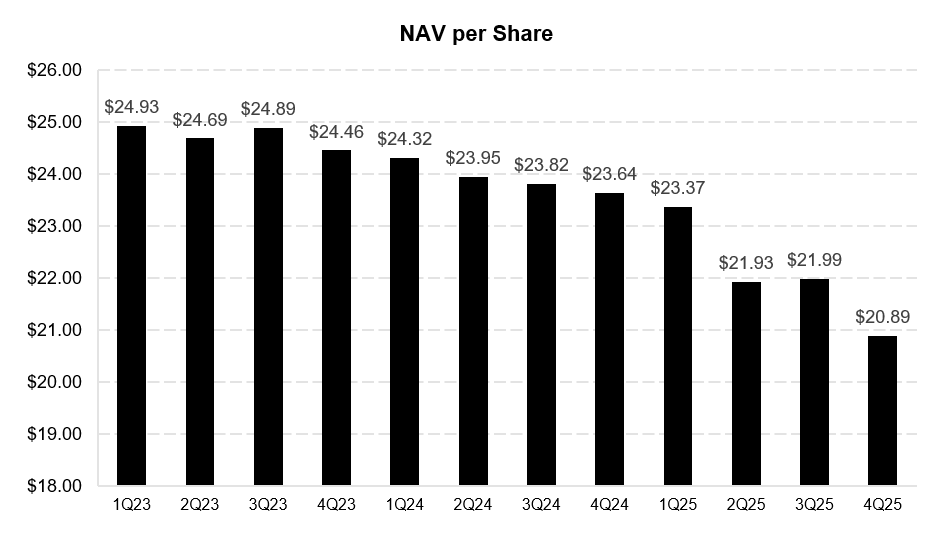
Reported fair value of the investment portfolio is $13 billion. Reported NAV is $5.85 billion, or $20.89 per share. The market values the equity at $10.51, a 50% discount.
Two questions to separate before going further. First, is the portfolio actually worth what management says it’s worth? Second, even if it is, what should the stock trade at?
Most analysis of BDC equity discounts conflates these. They’re different questions with different answers, and both are doing work in getting from $20.89 of reported NAV to $10.51 of market price. I’ll work through both.
I’ll get to the bond implications at the end. The work matters because it drives where the bond cushion really sits.