

The BDC Primer (Part 1)
What they are, how they work, and where they blow up
🚨 Connect: Twitter | Instagram | Reddit | YouTube | Job Board
Private credit was supposed to be the safe yield. Senior secured loans. Floating rate. Backed by the biggest names in asset management. Blackstone. Ares. Apollo. The adults in the room.
For most people, BDCs are the only way to directly access it. Business Development Companies (“BDCs”) take institutional-style loans and wrap them in a publicly traded stock. The same stuff the pensions get through locked-up funds with seven-figure minimums, you can buy in your brokerage account. With a fat dividend. What’s not to love?
Turns out, plenty.
Half the BDC sector now sits at 52-week lows. Dividends are getting cut. The software loans everyone piled into are under scrutiny. And the same managers who called this the “Golden Age” are asking you to trust their marks.
Trust their marks.
These are the people who get paid based on AUM. The bigger the portfolio, the bigger the fee. That creates an incentive to grow, even when the marginal loan isn’t as attractive. And they’re the ones driving the marks. You see the problem?
Software is the headline risk. Portfolios stuffed with loans to PE-backed companies that took on heavy leverage expecting growth that never showed up. Then rates spiked and these borrowers got crushed paying double-digit yields on floating-rate debt. Now there’s real uncertainty about whether these businesses are worth anything close to what the loans assumed.
But software isn’t the whole story. Base rates are coming down, which means floating-rate income is too. Spreads on new deals are at trough levels because every credit fund on the planet is fighting over the same middle market loans. Fees are eating into returns. And underwriting quality varies wildly. Some of these portfolios have real problems baked in that the marks don’t reflect.
The selloff has been indiscriminate. Good portfolios and bad portfolios, both down. The market isn’t distinguishing. It’s just selling. Which means either everything is cheap or nothing is.
Figuring out which is which requires understanding how these vehicles actually work. What the numbers mean. Where the risks hide. Why a 12% yield might be a gift or a trap depending on what’s underneath it.
This is Part 1 of a series. The foundation. What BDCs are. How they make money. Where they blow up. If you already know the product, skip to Part 2 where I get into the metrics, the trading dynamics, and what actually separates the good names from the bad ones.
What Are BDCs?
A BDC is a publicly traded company that lends money to mid-sized American businesses.
Private credit is the asset class. BDCs are one vehicle to access it. The difference matters. Institutional investors access private credit through closed-end funds with multi-year lockups and high minimums. Retail investors get BDCs: the same underlying loans, but wrapped in a publicly traded stock you can buy and sell any day the market is open.
What investors think they’re buying
Think of it like a bank you can buy stock in, except instead of taking deposits it raises capital from investors and the bond market. It makes loans, earns interest, subtracts its own borrowing costs and fees, and passes most of what’s left to shareholders as dividends.
That’s the business.
The borrowers are typically private equity-backed companies doing somewhere between $10 million and $250 million in annual cash flow. Too small to issue bonds in the public markets. Too large or too leveraged for a traditional bank to want to deal with. BDCs fill that gap.
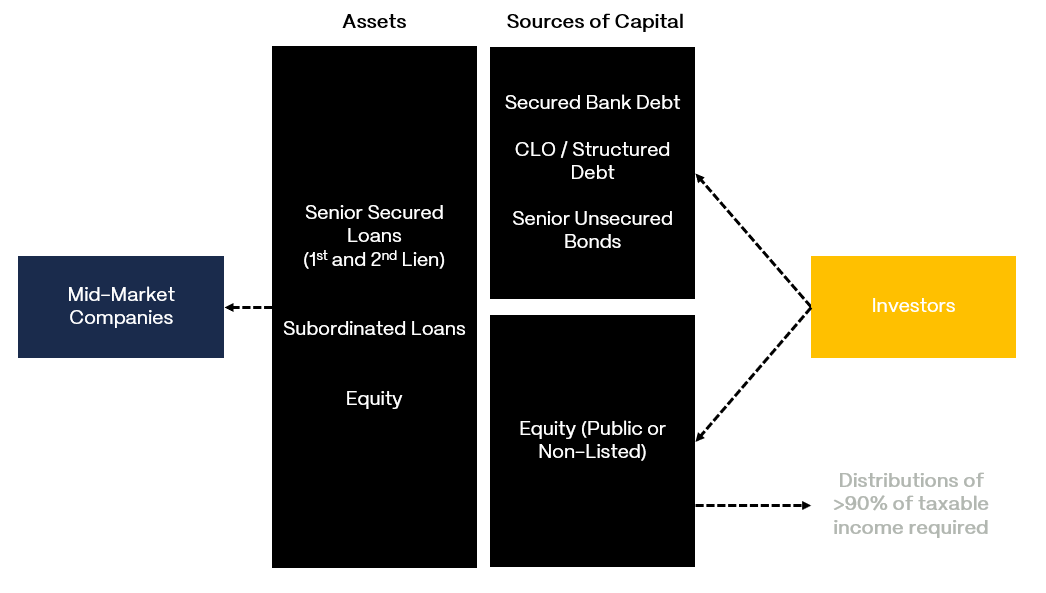
The loans themselves are overwhelmingly floating rate and senior secured. The interest resets as rates move. The BDC sits at the top of the capital structure if something goes wrong. Most portfolios are 70 to 90% first lien. That seniority doesn’t mean you can’t lose money, but it means you’re first in line for recovery when a borrower runs into trouble.
By law, BDCs have to distribute at least 90% of their taxable income to shareholders. That’s not management being generous. It’s a regulatory requirement in exchange for not paying corporate taxes, similar to how REITs work. The result is dividend yields that typically run 10 to 12%, which is what draws most investors to the space in the first place.
Congress created the BDC structure in 1980 to channel capital toward smaller companies that couldn’t access public markets. Forty-six years later, the vehicle has evolved well beyond that original intent. Blackstone, Ares, Apollo, KKR, Blue Owl, Morgan Stanley all run publicly traded BDCs now. What started as a niche corner of the market has become the primary way public market investors access private credit.
One important structural point. BDCs are closed-end vehicles with permanent capital. Unlike a mutual fund or an open-end private credit fund, a publicly traded BDC doesn’t face redemptions. If investors want out, they sell their shares on the exchange. The BDC itself doesn’t have to liquidate anything. That’s a meaningful advantage in a downturn. The manager isn’t forced to sell loans at distressed prices to meet redemption requests. It’s also one of the key differences between publicly traded BDCs and the non-traded perpetual BDCs that have been grabbing headlines lately with rising redemption queues.
Why the gap exists
Banks used to dominate middle market lending. Not anymore. Post-2008 regulations made leveraged loans expensive to hold on bank balance sheets. The 2013 interagency leveraged lending guidance pushed banks further out of the market.
BDCs filled that gap. They can hold the loans banks won’t. They can lend to companies too small for the bond market but too leveraged for traditional bank credit. And because they’re lending into a market with fewer competitors and more friction, they can charge yields that would be impossible in liquid, efficient markets.
That’s the whole pitch: structural inefficiency creates excess yield. Whether that inefficiency persists, and whether the yields actually compensate for the risk, is the question.
What BDCs are NOT
BDCs are not bond funds. They are not banks. They are not money market substitutes. The “safe yield” framing is marketing, not reality. These are levered portfolios of illiquid loans marked quarterly by managers who have every incentive to smooth the volatility. The marks are model-driven, not market-driven. That distinction matters when things go wrong.
Why Do They Matter Right Now?
Private credit has blown past a trillion dollars in AUM. BDCs are the only real way most investors can access it. But the easy money in this trade is behind us.
The trade that worked, and why it’s breaking
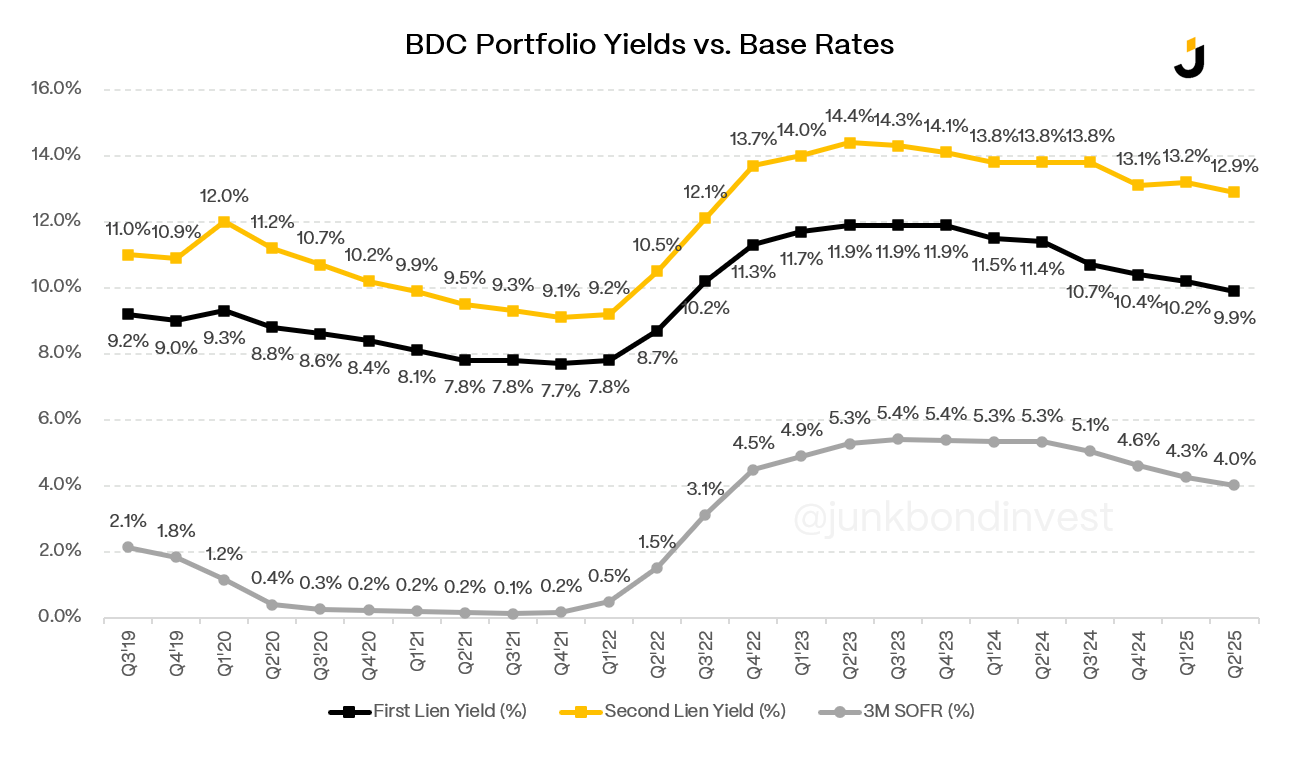
The cycle that minted BDC returns over the past three years was simple. Fed hikes. Floating-rate income surges. Dividends get raised. Stocks rally. Now every leg of that trade is running in reverse. Rates are coming down. Portfolio yields are falling with them. Several names have already cut dividends or flagged cuts for 2026.
The rate sensitivity isn’t uniform across the sector though. Most BDC loans have SOFR floors built in, typically around 1-2%. That means if SOFR drops below the floor, the loan yield doesn’t fall any further. Some managers also run interest rate swaps or caps to hedge their exposure. The disclosed rate sensitivity tables in the 10-Qs are worth checking when comparing names.
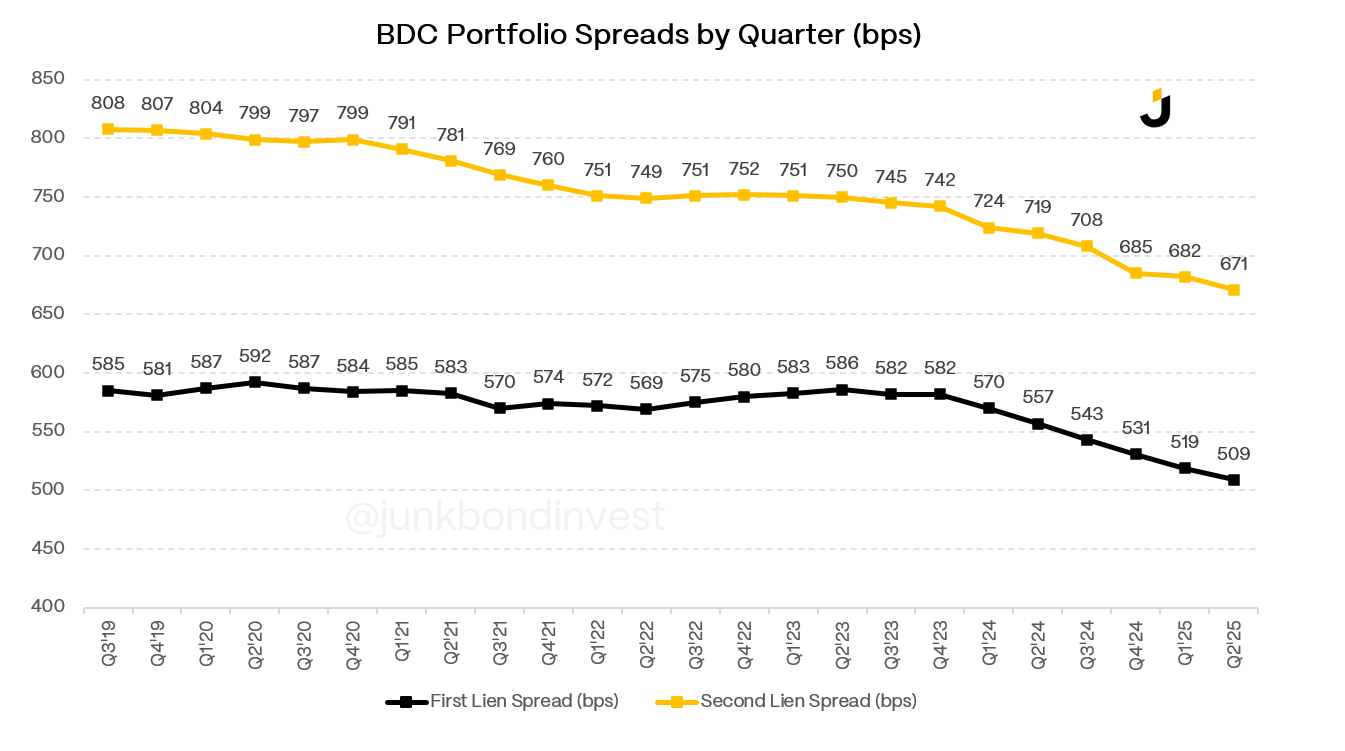
Competition is squeezing the business from the other direction. Spreads on new originations are near trough levels. The broadly syndicated loan market has gotten aggressive on pricing and is winning deals that would’ve gone to direct lenders a year ago. In December 2025, the OCC and FDIC formally withdrew from the 2013 leveraged lending guidance and 2014 FAQs, which could bring banks back into middle market lending more aggressively. And it’s not just new originations. BDCs are also seeing their existing back-books get refinanced at tighter spreads as borrowers take advantage of the competitive environment to reprice their debt.
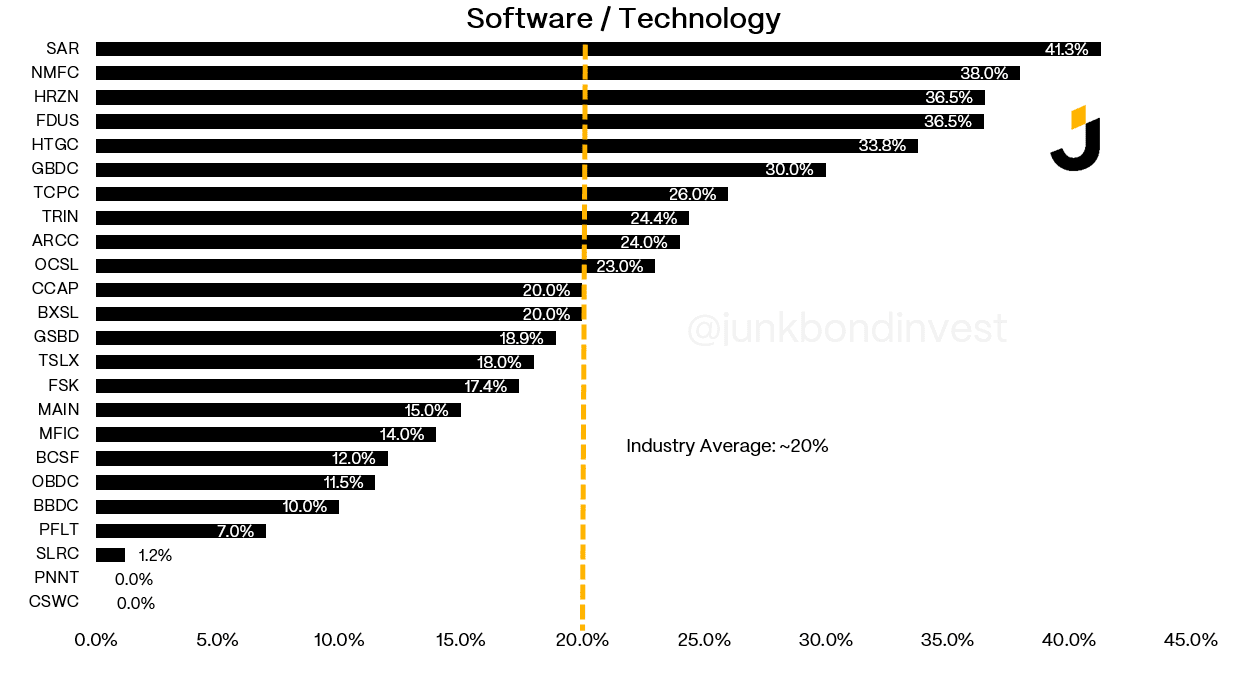
Software is the single largest sector exposure across the BDC universe. Around 20% of aggregate portfolio value. The concentration happened because software businesses were viewed as recession-resistant due to sticky recurring revenue. That thesis may prove correct from a fundamental standpoint. But the lending was done at valuations that embedded a lot of optimism, and now those valuations have corrected hard.
The issue isn’t just “software is bad.” It’s the combination of factors: entry valuations that assumed lofty multiples in a market now paying far less, leverage levels that assumed continued growth, PE sponsors who may not have the appetite or capacity to inject more equity, AI uncertainty creating real questions about terminal value, and refinancing pressure as borrowers approach maturity on debt they took on at better terms.
And the exposure isn’t evenly distributed. Some BDCs have 30%+ in software. Others are closer to 10-12%. If anything, these figures understate reality. Managers have discretion over how they classify credits, and plenty of software-adjacent deals end up labeled “business services” or “healthcare IT.” When you see a name trading at a wider discount than peers, check the software allocation before assuming the market is wrong.
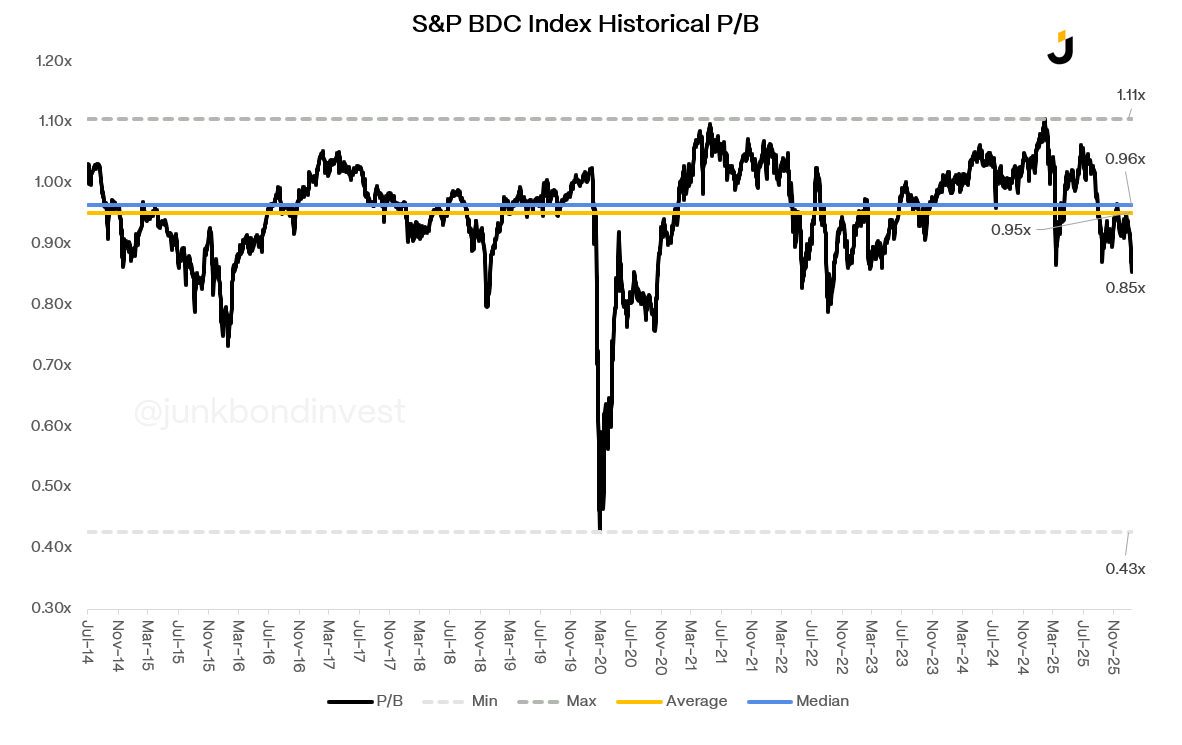
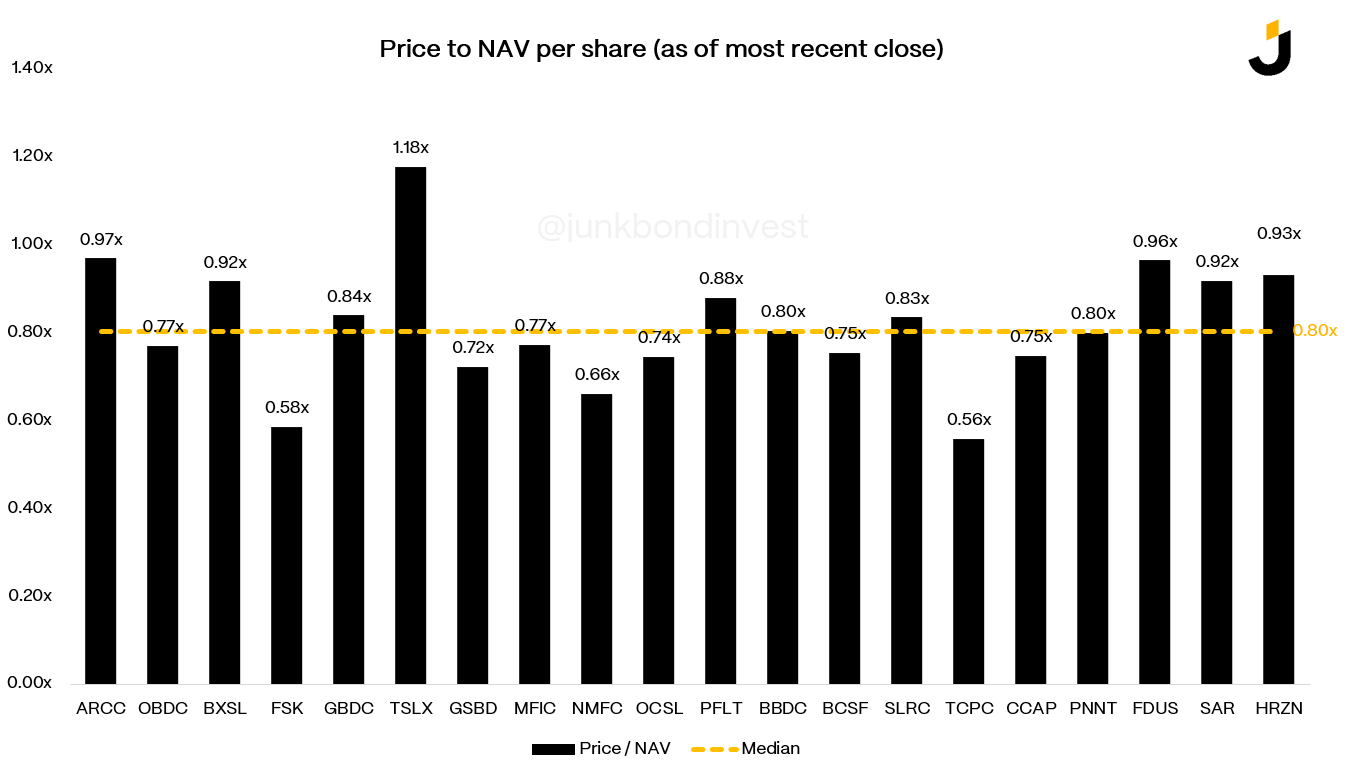
The stock prices reflect the anxiety. The sector trades below NAV, below the five-year average closer to par. Many individual names trade at 0.70x to 0.85x book.
Meanwhile, the non-traded side of the BDC market is showing cracks. BCRED, Blackstone’s flagship non-traded credit fund, saw estimated repurchases run to around 4.5% of shares outstanding in 4Q’25. That doesn’t directly affect publicly traded BDCs, but it signals that sentiment toward the broader private credit space is shifting.
The question is whether the market is right or whether this is an overreaction. BDCs yielding 10-12% on senior secured credit, trading at meaningful discounts to book value. That setup has historically rewarded buyers willing to do the work on individual names. But the margin for error is thinner than it’s been in years. The next leg is going to be about credit selection, not rates.
How BDCs Make Money
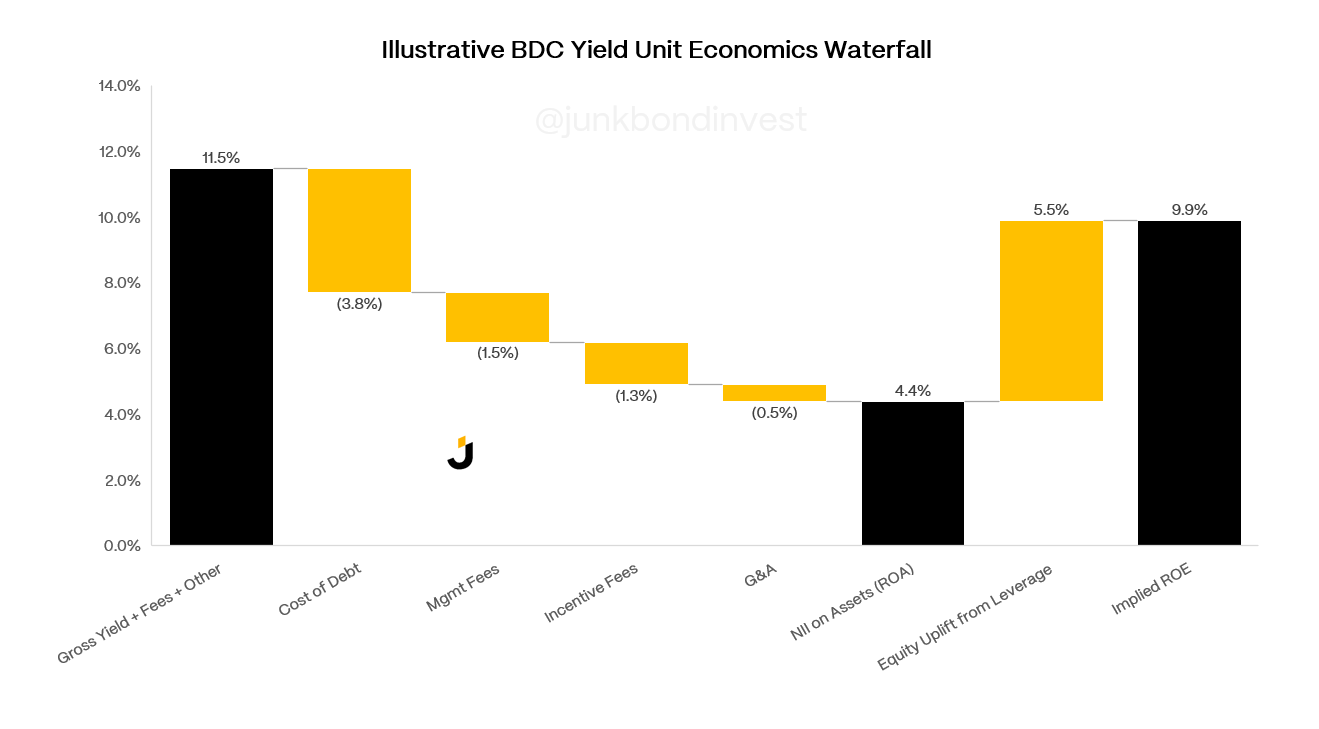
The business model is straightforward. Borrow money at one rate. Lend it out at a higher one. The difference is the spread. The spread is how shareholders get paid.
On the asset side, the typical BDC portfolio yields somewhere around 10-11%. On the liability side, the blended cost of funding is meaningfully lower because BDCs finance themselves with a mix of equity (no interest cost), unsecured bonds, and revolving credit facilities. The gap between what they earn and what they pay is the net investment spread, and it flows through to shareholders as dividends after operating expenses and fees.
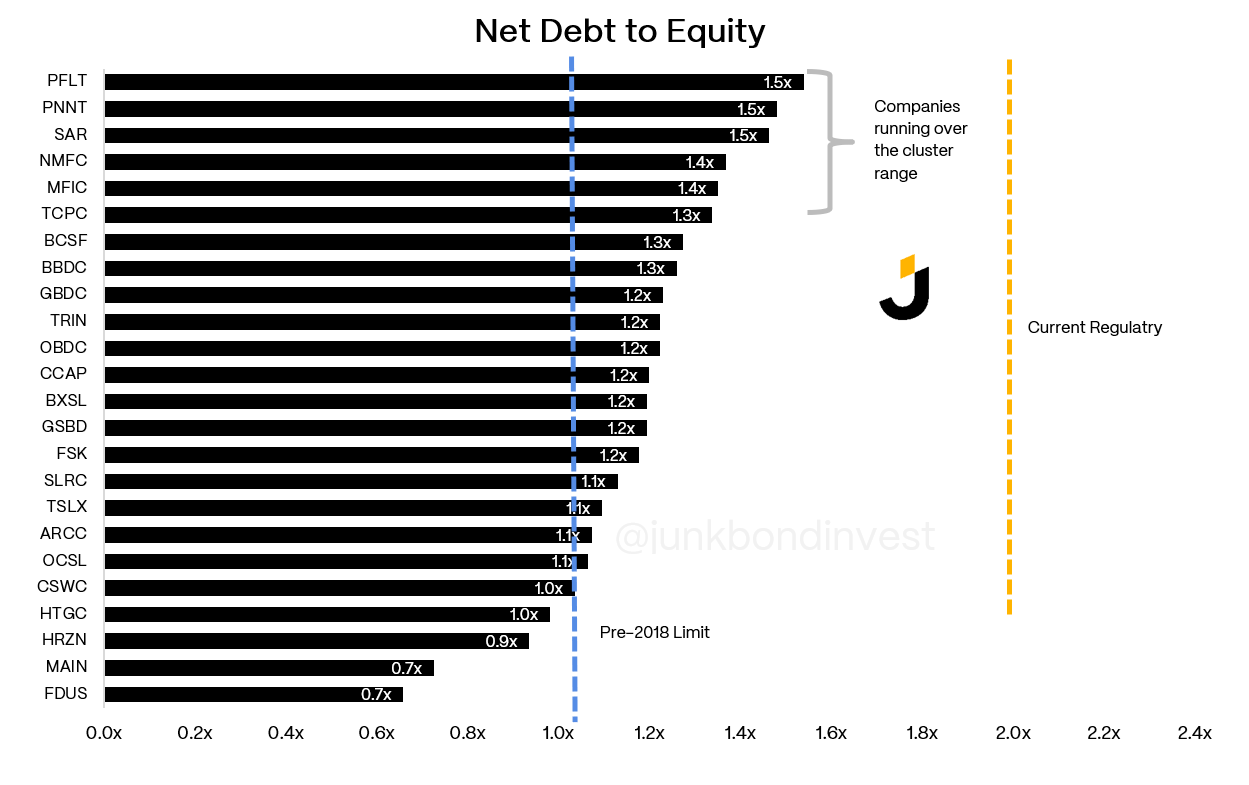
A note on leverage. BDCs are allowed to run a maximum debt-to-equity ratio of 2.0x. That limit was raised from 1.0x in 2018 under the Small Business Credit Availability Act, which effectively doubled the borrowing capacity of the entire sector overnight. In practice, most BDCs operate well below the cap, typically in the 0.9x to 1.25x range. But the headroom matters. A BDC at 1.0x leverage has significant capacity to grow the portfolio without raising equity. A BDC already at 1.4x has less room to absorb mark-to-market losses before bumping up against the regulatory ceiling.
Now the number that actually matters.
Net investment income. NII. This is the metric. It strips out unrealized and realized gains and losses on the portfolio and just captures the recurring income from making loans. Interest income at the core, plus some fee income from origination and amendment activity.
NII is what covers the dividend. If NII per share exceeds the dividend, the payout is sustainable. If it doesn’t, something has to give.
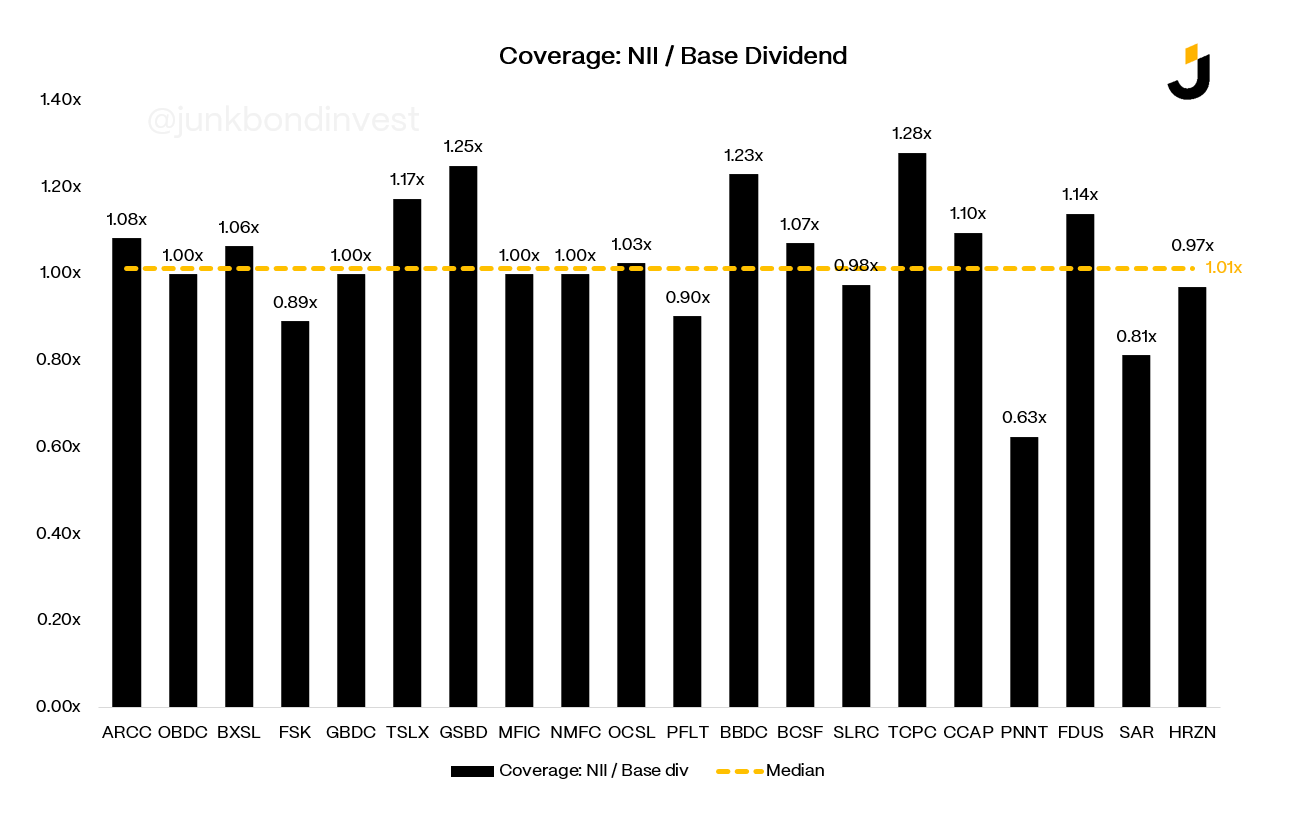
GAAP net income is a different animal entirely. It includes mark-to-market changes on the portfolio, which can swing wildly quarter to quarter without reflecting any actual cash event. A loan getting marked down two points doesn’t mean the borrower stopped paying. Useful for tracking credit trends over time, but NII is the line that tells you whether the dividend check is real.
Now here’s where it gets less pretty. Most BDCs are externally managed. The actual investing is done by an affiliated advisor that charges fees for the privilege. Two layers. A base management fee, usually 1.0 to 1.5% of total assets (not equity but assets, meaning you’re paying fees on borrowed money). And an incentive fee, typically 15-20% of NII above a hurdle rate. The fee math matters more than most investors realize, and it’s one of the first things to check when comparing names. More on manager incentives in Part 2.
The Liability Side: Where BDCs Blow Up
Most BDC analysis focuses on the asset side. What loans do they own. What’s the credit quality. What’s the yield. That makes sense because the assets generate the income.
But BDCs can blow up on the liability side too. And when they do, it happens fast.
The typical BDC funds itself with three sources: revolving credit facilities from banks, unsecured bonds, and equity. Some also use SBIC debentures from the SBA (cheap, long-term, fixed-rate government-backed debt available to BDCs). The mix matters for flexibility, cost, and refinancing risk. I’ll go deeper on the liability stack in a separate BDC Debt post.
The immediate issue is that a lot of BDCs issued cheap unsecured debt in 2020 and 2021 when rates were near zero. Five-year paper at 3-4% coupons. That debt is now coming due, and refinancing it means issuing at 6-7% or higher. Even if the asset side of the portfolio is perfectly fine, the higher funding cost flows straight through to NII. This is a real earnings headwind that has nothing to do with credit quality.
The more dangerous dynamic is forced deleveraging. BDCs have to maintain asset coverage ratios under the Investment Company Act, which translates to a maximum 2.0x debt-to-equity. If NAV drops because of mark-to-market losses, leverage mechanically increases even if the BDC didn’t borrow another dollar. When that happens, the BDC has limited options: sell assets at unfavorable prices, cut the dividend to retain capital, or try to raise equity at a deep discount. TCPC’s late-2025 spiral is a real-time example of how credit marks, leverage constraints, and rating agency pressure can compound on each other.
This is why the liability structure deserves as much attention as the asset side. A BDC with a well-laddered maturity schedule, low leverage, and no near-term refinancing needs has far more flexibility to weather a downturn than one running hot on leverage with a wall of debt coming due.
What’s Next
That’s the plumbing. How BDCs work, where the money comes from, where it goes, and what can break.
But knowing the mechanics doesn’t tell you whether a BDC trading at 0.75x book is a bargain or a trap. That depends on what the numbers are actually saying, how these things trade, what’s hiding in the portfolio, and who’s running it.
Part 2 covers the metrics that matter, the mark lag problem, what separates good credit books from bad ones, and why manager selection matters more here than almost anywhere else in public markets.
Part 3 flips to the liability side. The funding stack, borrowing base mechanics, asset coverage tripwires, the 2026 maturity wall, and what happens when a BDC loses its investment-grade rating. The bond market often knows before the equity does.
Read both here.
The BDC Primer (Part 2)

The BDC Primer Part 1 (below) covered the plumbing. What BDCs are. How they make money. Where they blow up.

Find the most recent JunkBondInvestor posts below:


Disclosure: The information provided is for informational purposes only and does not constitute investment advice, financial advice, trading advice, or any other sort of advice. You should not treat any of the content as such. The author does not recommend that any security, portfolio of securities, transaction, or investment strategy is suitable for any specific person. The information provided is based on publicly available sources believed to be reliable, but the author makes no representations or warranties as to the accuracy, completeness, or timeliness of such information. The author assumes no obligation to update or revise any information, whether as a result of new information, future events, or otherwise. Past performance is not indicative of future results. All investments carry risk, including the potential loss of principal. BDCs in particular involve risks including credit risk, interest rate risk, leverage risk, liquidity risk, and valuation risk. The author may hold positions in securities mentioned in this content and may buy or sell such securities at any time without notice. The author has no obligation to disclose such positions or changes thereto. Nothing in this content should be construed as a solicitation or offer to buy or sell any security. Any investment decisions made based on the information provided are solely your responsibility. You should conduct your own research and consult with a qualified financial advisor, accountant, and/or attorney before making any investment decisions. By reading this content, you acknowledge and agree that the author shall not be held liable for any losses, damages, or other consequences resulting from your use of or reliance on this information.
This is the most comprehensive post I have read so as to understand BDC as a sector. Definitely waiting for the second part.
I can’t agree with SD enough. Concise and well researched. One doesn’t see enough of this quality in today’s world. Ty.