

Credit Weekly: Foundation Cracks
Software gets all the attention. Building products is quietly becoming one of the most distressed sectors in leveraged credit.
You already know the situation in software. I’ve talked about it. Everyone has talked about it. IGV 0.00%↑ rolling over again, software loan spreads at >800bps, AI disruption hitting exactly the credits that got taken private at peak multiples with maximum leverage. It’s the most covered sector in leveraged credit right now, and for good reason.
Meanwhile, another sector is breaking down just as badly, for unrelated reasons, and getting a fraction of the coverage.
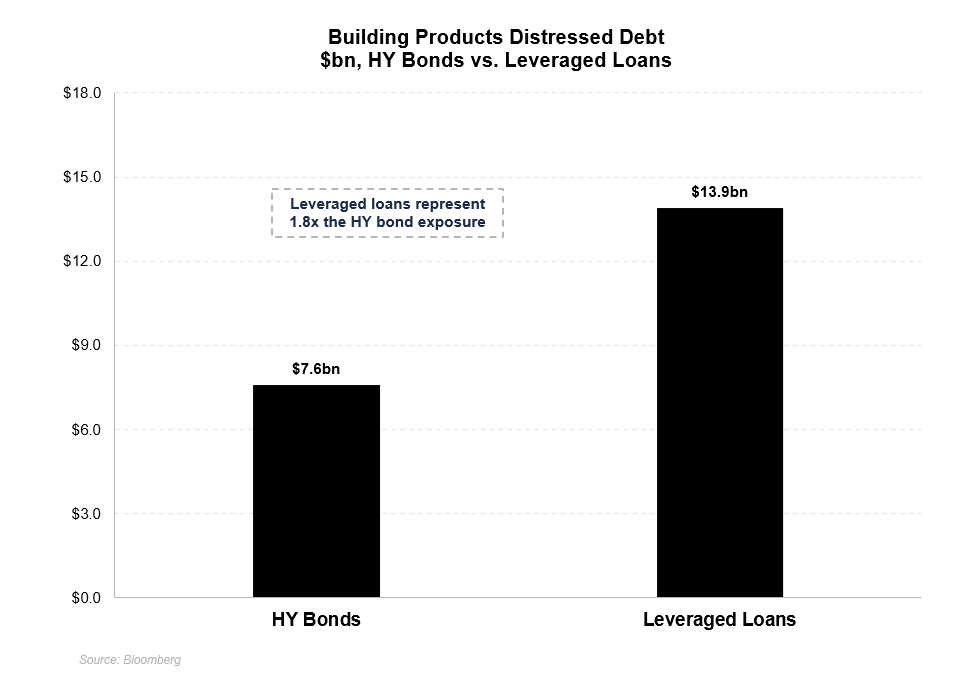
Building products is the 2nd worst performer across high yield and leveraged loans YTD. $20+ billion of distressed debt, with private issuers that still haven’t reported Q4. When those numbers land, the picture gets worse. Four simultaneous headwinds hitting capital structures that were built for a completely different environment. The mainstream financial press has largely looked past it.
The loudest story in leveraged credit right now has most people looking in one direction. This week’s post is about what’s happening in the other one.

The Setup
The housing market broke in 2022 and the repair timeline keeps getting pushed out.
Rates went from 3% to 7% in twelve months. Existing home sales collapsed. The homeowners sitting on sub-3% mortgages stopped moving. Transaction volume, which drives demand for everything that goes into a home, fell off a cliff.
That much is well understood.
What’s less understood is the sequence of what happened next and why the pain is arriving now rather than two years ago.
When rates spiked, new construction didn’t stop immediately. Builders had backlogs. Units started in 2021 and 2022 kept completing through 2023 and into 2024. Building products manufacturers watched their order books and concluded the cycle was holding. Revenue held up. EBITDA held up. Sponsors told lenders the worst was behind them. It wasn’t.
The completions backlog cleared in late 2024. When it did there was nothing behind it. Starts had been running below replacement for two years.
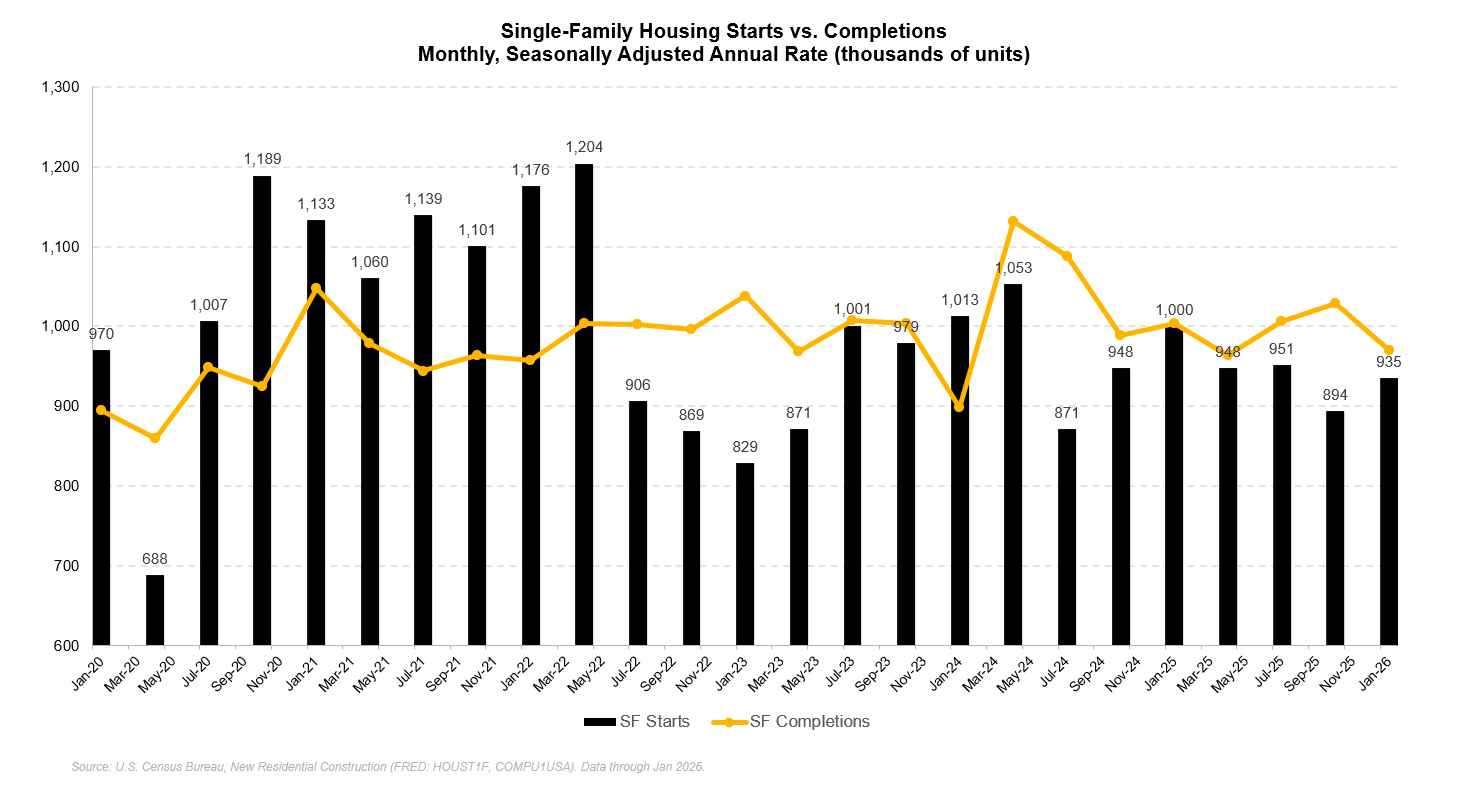
Volume fell sharply and the manufacturers had no buffer. Cost structures built for boom-cycle volumes. Debt loads underwritten to boom-cycle EBITDA. Neither of those things existed anymore.
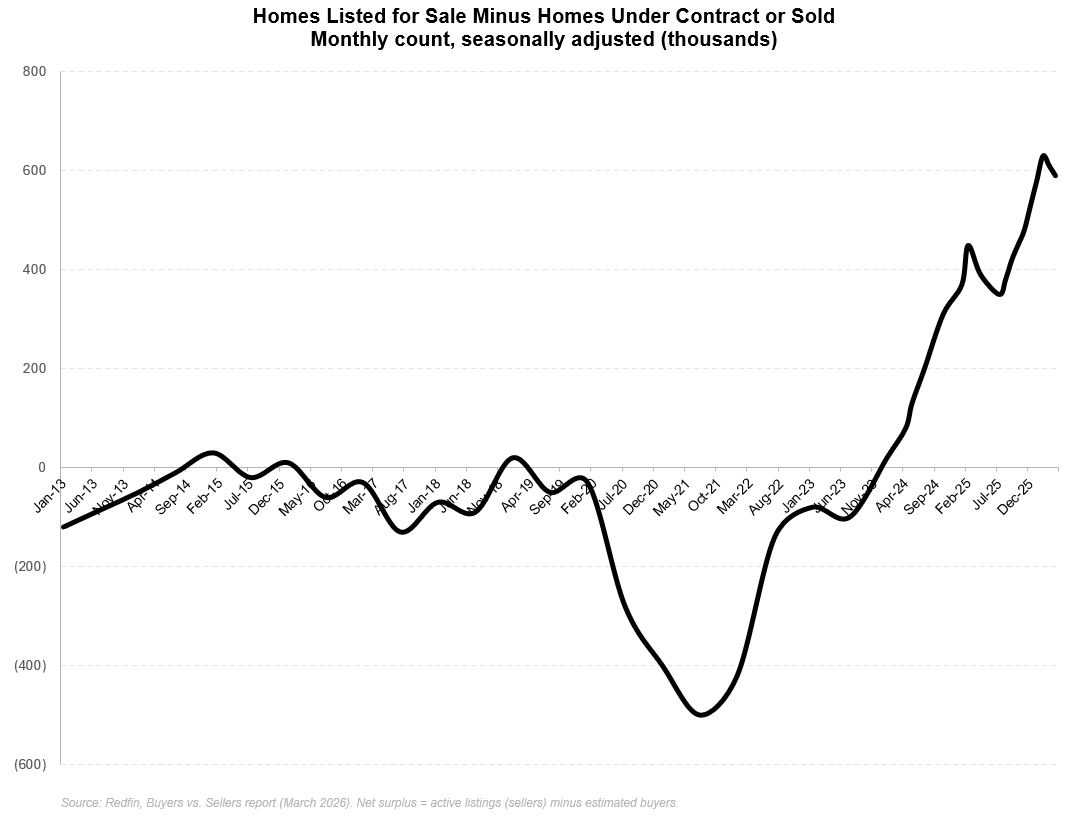
The data today confirms the damage is deepening rather than stabilizing. Only 3% of the housing stock is currently turning over versus 4-5% in a normal environment. That has happened only 4 times in 50 years. In February, there were 630,000 more home sellers than buyers in the United States, the largest gap in records going back to 2013. The market is not clearing.
Home Depot’s CFO called the housing recovery a 2027-plus story at the JPM conference last week. KB Home recently cut its full year guidance. This is a public homebuilder putting hard numbers on the completions cliff that building products credit markets have been pricing for months.
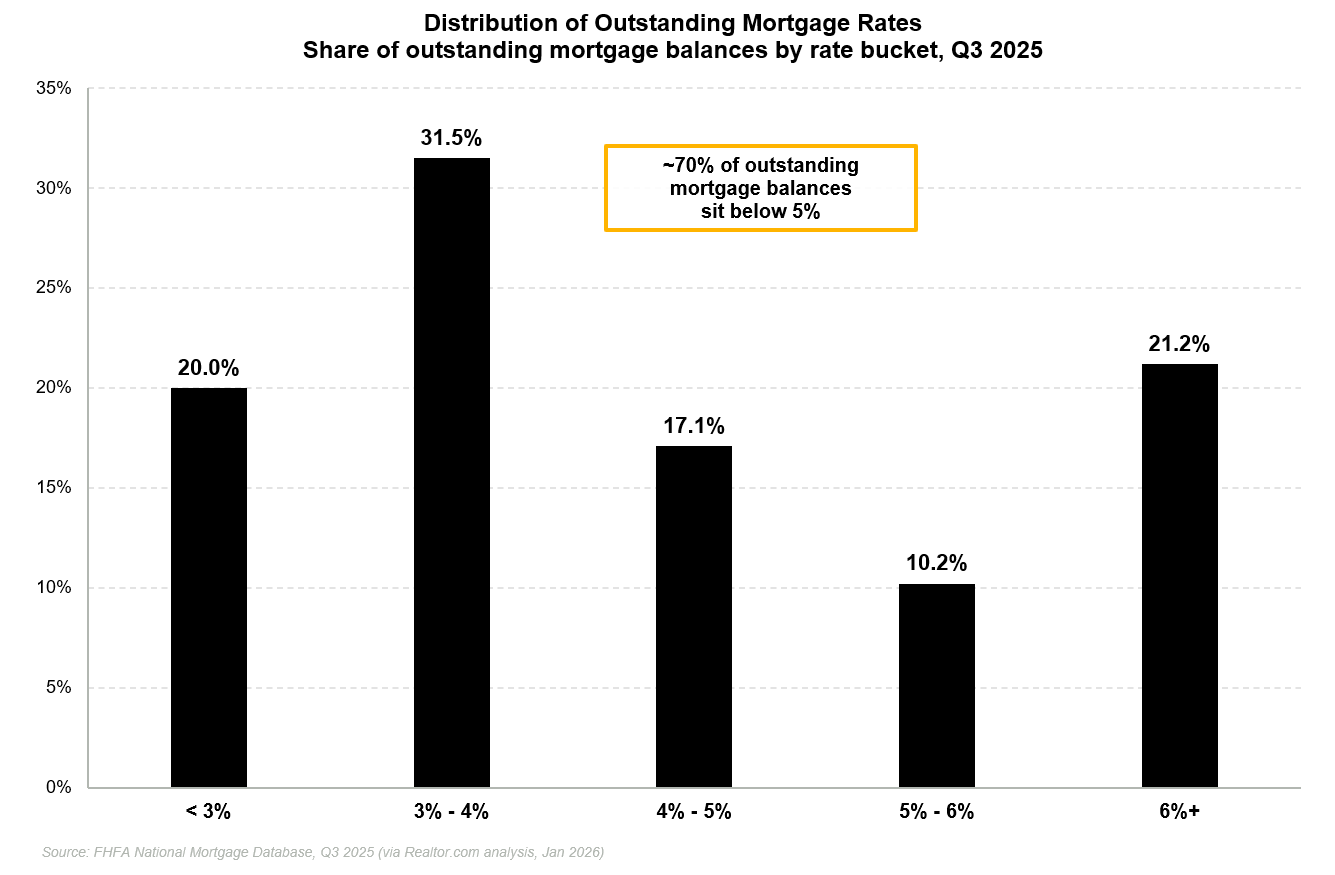
~70% of outstanding mortgages carry a rate below 5%. Every one of those homeowners faces a moving penalty measured in hundreds of dollars per month in higher payments if they transact. This doesn’t resolve until either rates fall meaningfully or home prices correct enough to offset the payment gap.
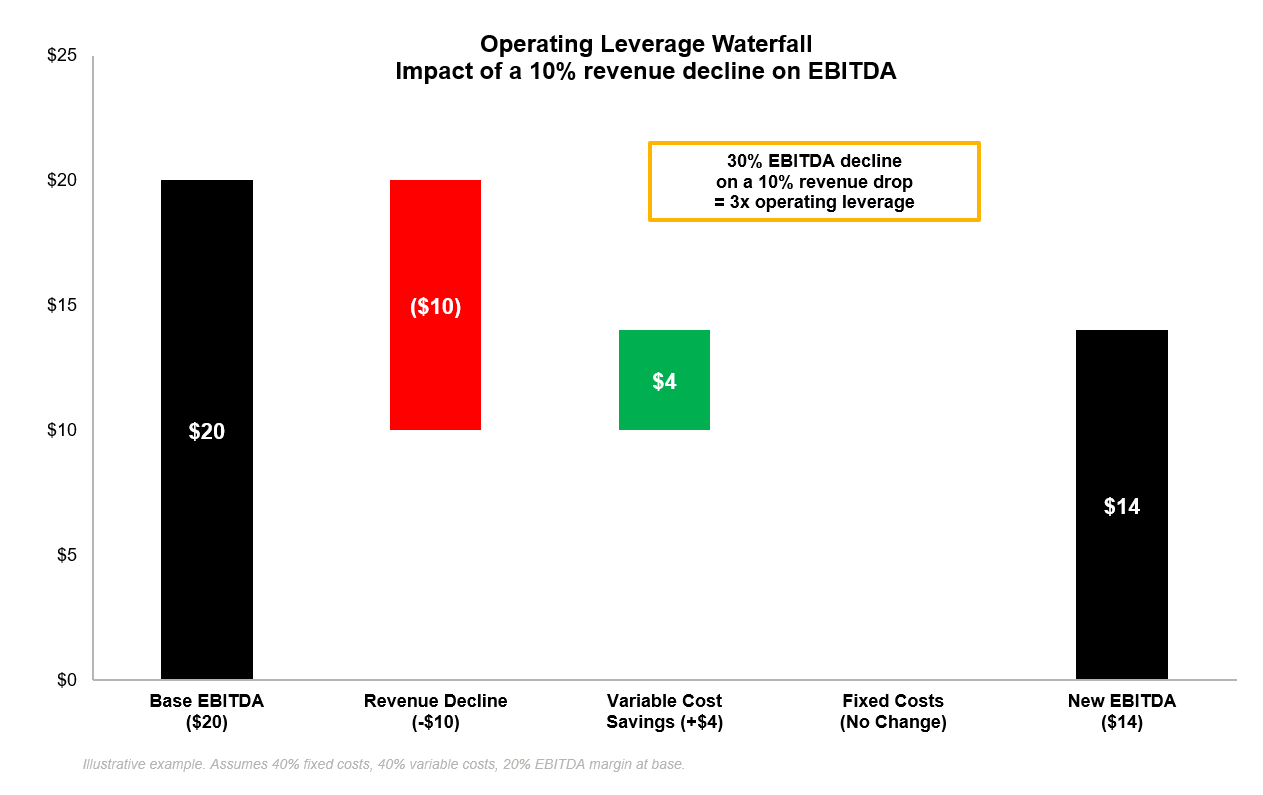
The operating leverage math makes it worse than the revenue figures suggest. A 10% revenue decline doesn’t produce a 10% EBITDA decline for these companies. Fixed cost bases built for 2021-2022 volumes mean a modest revenue move translates into a catastrophic margin move. The damage is disproportionate to the revenue move because the cost structure doesn’t flex.
That’s just the operational side of things. Then the Iran conflict layered an entirely new set of problems on top of an already impaired setup.
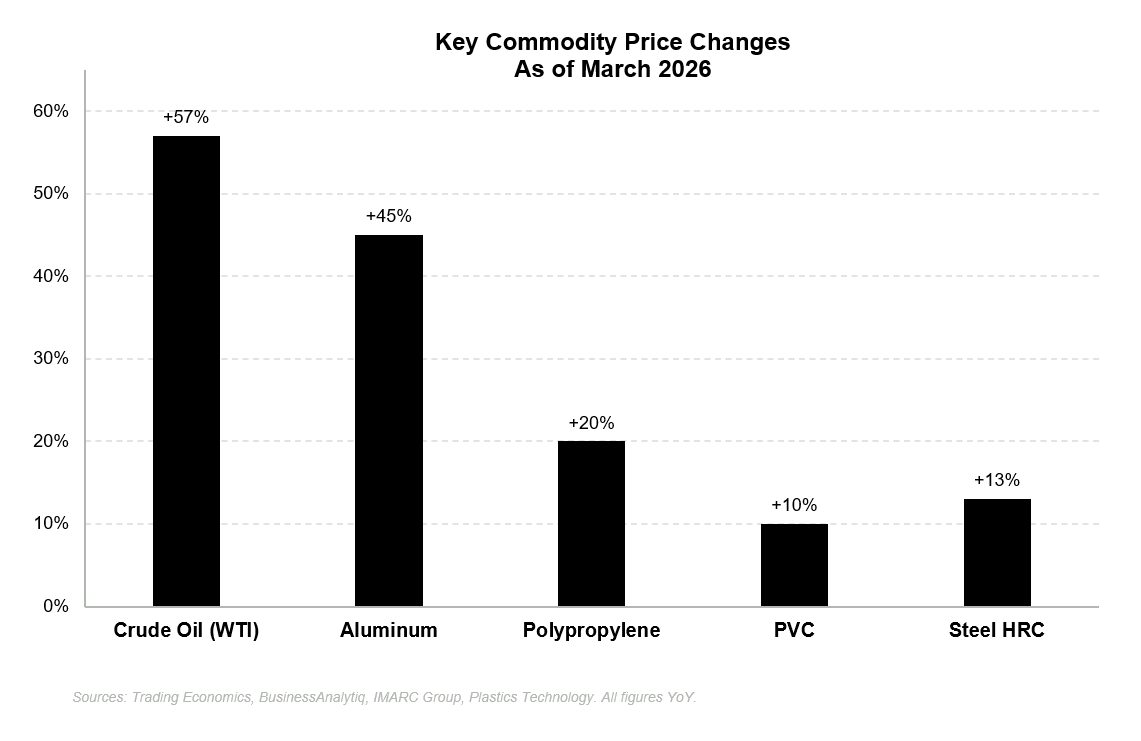
Crude oil is up over 50% year-over-year and sitting at nearly $100 per barrel. For building products manufacturers this isn’t an abstract macro variable. Asphalt, PVC, resins, petrochemicals. All of it moves with oil. Polypropylene was up 20% in March alone. Aluminum now up 45% year-over-year. These are the direct inputs for windows, doors, insulation, and building envelope products. Earnings will begin to reflect input cost pressure regardless of what diplomats agreed to.
Aluminum tariffs compound the problem on a separate track with no clean resolution. The tariff tailwind that was supposed to help domestic manufacturers by shutting out Chinese competition never materialized because demand collapsed simultaneously. They got the cost inflation from tariffs on their own inputs. They never got the pricing umbrella on the revenue side.
Four simultaneous headwinds, each with a different resolution timeline, none of which the companies control. Suppressed housing demand. Unaffordable new construction economics. Oil-driven input cost inflation. Aluminum tariffs. It would be a difficult environment for a normally capitalized sector.
Building products is not normally capitalized.
The Debt Structure Trap
Many of these companies were taken private or recapitalized during the 2020-2022 window, and the capital structures reflect the assumptions of that moment. Housing demand was booming. Rates were near zero. PE multiples were expanding. Leverage at 8-10x made sense when debt cost 4% and end markets were growing.
That window closed but the debt didn’t go with it.
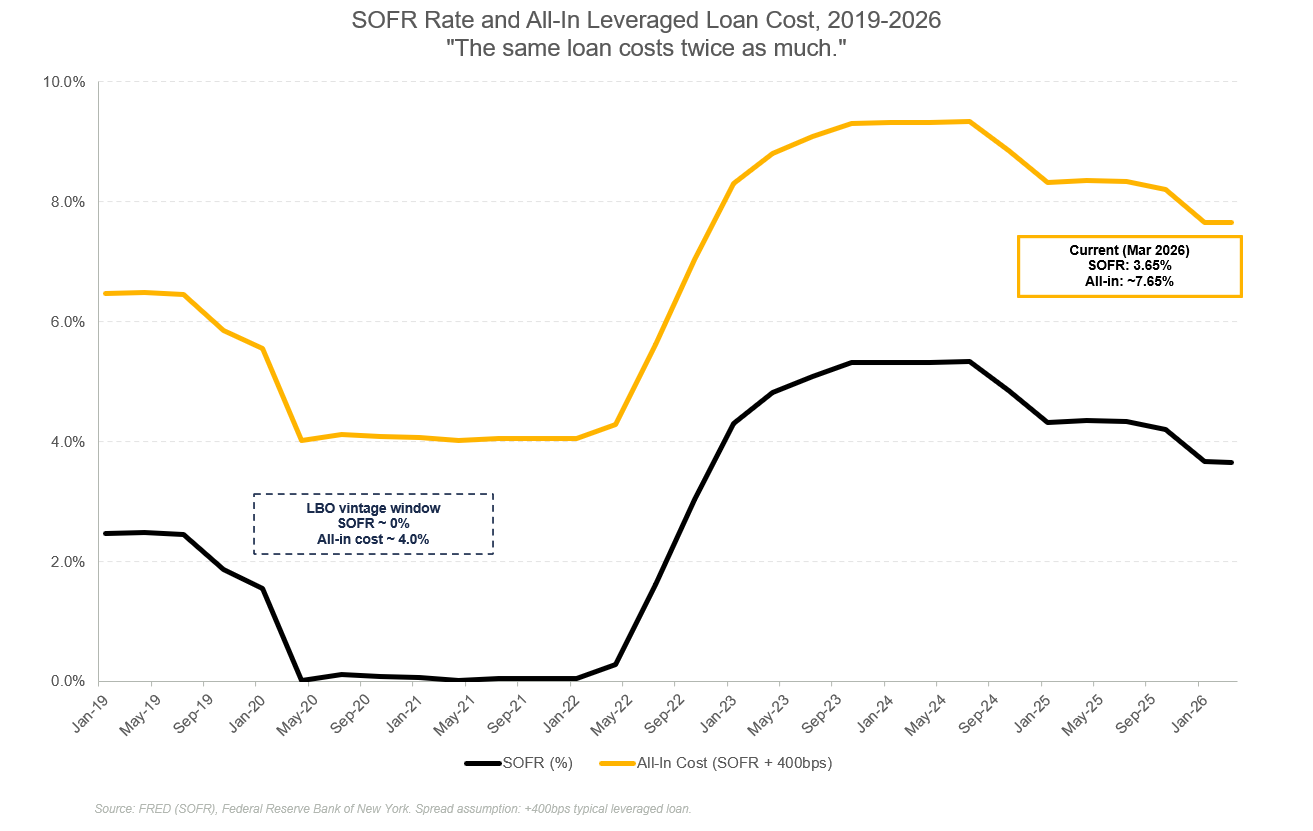
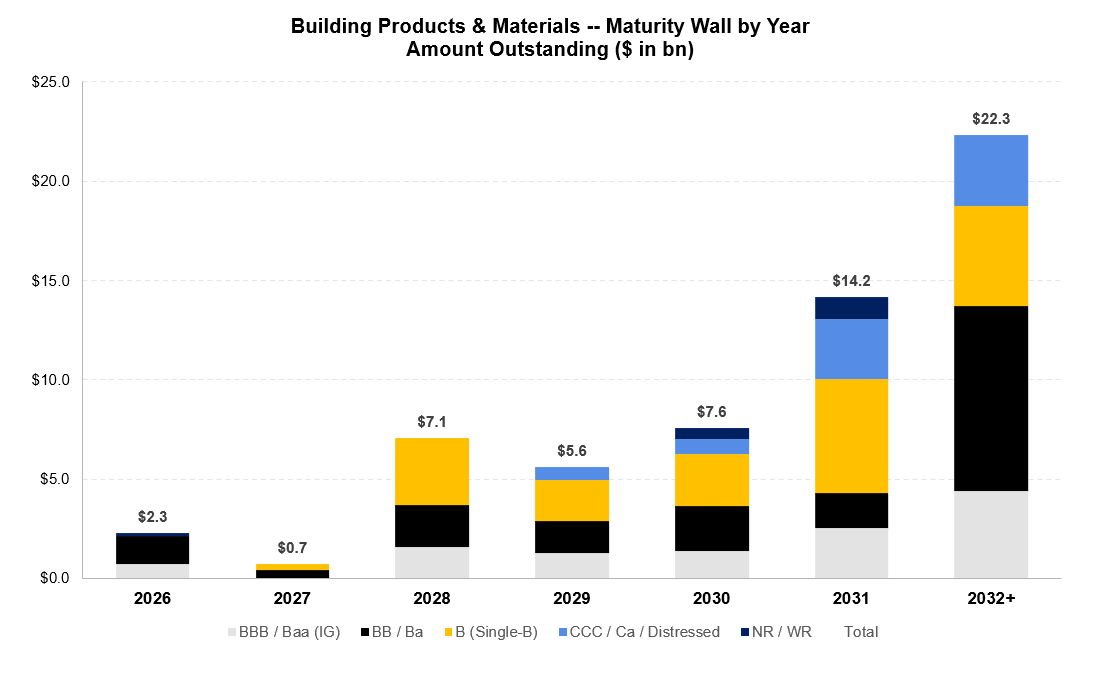
Those floating rate loans priced at SOFR plus 400bps that cost roughly 4.5% all-in when SOFR was near zero now cost closer to 9%. Cash interest expense has effectively doubled without any change in the principal balance. Coverage ratios have deteriorated not only because EBITDA collapsed but because debt service also did damage. The cov-lite structures that gave sponsors flexibility on the way up now give lenders limited visibility on the way down. And the maturity walls that felt distant in 2021 are now a 2027-2029 problem that is no longer theoretical.
The refinancing math doesn’t work for the most levered names. A company running at 8-10x leverage with interest coverage <1x cannot access the loan market at any reasonable cost. The HY bond market is closed to credits with those metrics. The path forward is either an operational recovery that organically deleverages before the maturity wall arrives, an LME such as a distressed exchange, or an outright restructuring. In the current operating environment, organic recovery is the hardest path to underwrite.
Why It’s Flying Under the Radar
If the data is this clear, the obvious question is why this sector isn’t generating the same attention as software.
The answer comes down to how these companies are financed and who owns them. Most of the stressed names are PE-owned, financed primarily with leveraged loans, and not subject to regular public disclosure requirements. They report to lenders behind invite-only datarooms. When deterioration begins, it shows up first in secondary loan prices as informed holders sell. By the time it surfaces as a public narrative, the stress has often been building for months.
Software names generate headlines because they have visible equity comp points that move markets. Building products names don’t have that information infrastructure. The stress is real. The signal is just harder to see.
There’s also a selection bias in how people read sector-level credit data. The HY bond index sample of building products companies skews toward the larger, better-capitalized names that had access to the public bond market in the first place. The loan market sample includes the aggressive 2020-2022 LBO transactions done at peak valuations with maximum leverage. When you look at HY bond performance for the sector, you’re largely looking at the survivors. The loan market is where the bodies are.
There is also a technical dimension worth understanding. ~75% of BSLs are held inside CLOs. When those CLOs move past their reinvestment periods they become forced sellers rather than natural holders. Par 1L prices in some of these names are a technical artifact of CLO demand, not a fundamental signal about enterprise value.
I wrote about one of the public names in this sector in detail last year, before the deterioration became this visible. Check it out here.

What the Market Is Saying
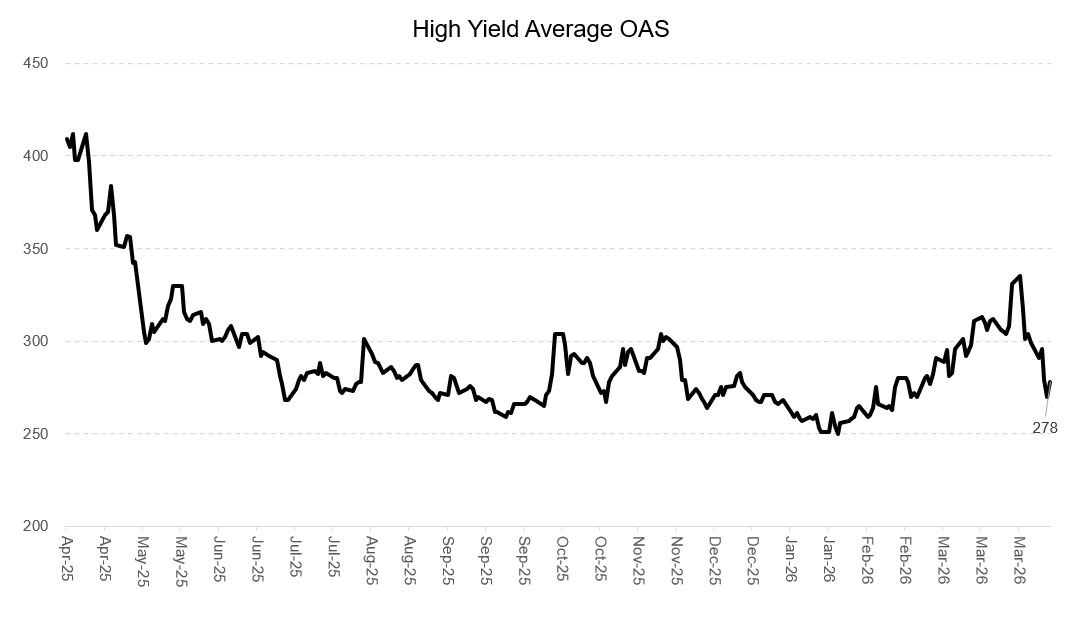
This week’s broader HY rally makes the building products situation easier to miss, not easier to dismiss.
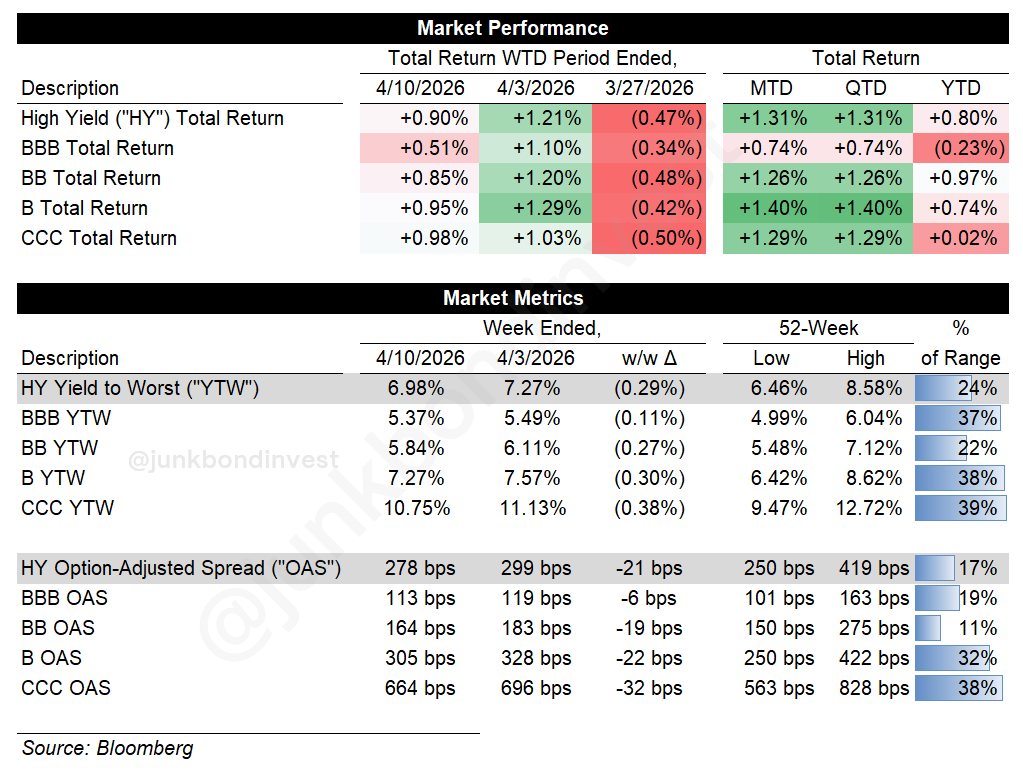
HY spreads tightened roughly 21bps on the week to 278bps, driven almost entirely by the ceasefire relief trade. The index returned +0.90% on the week and is now positive on the year at +0.80%. The index is averaging a functioning market and a deteriorating one into a single number that flatters the former and obscures the latter.
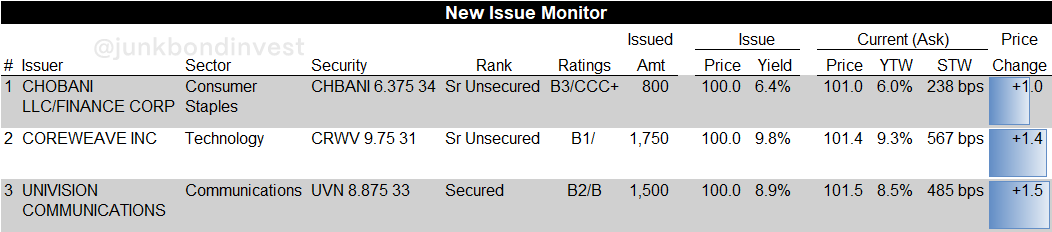
Primary market activity in the sector has been essentially nonexistent. Last week, CoreWeave printed $1.75bn at the tight end of talk. Univision printed $1.5bn. Building products names have been absent from the new issue calendar this year entirely. Two primary markets are running in parallel right now, and building products is firmly on the wrong side of that divide.
What to Watch
The spring selling season over the next four to six weeks is the verdict.
Monday’s existing home sales print for March will be backward-looking, reflecting contracts signed in January and February before the Iran conflict and before mortgage rates moved higher. Even a decent print tells you nothing about current reality. The real verdict arrives in April and May data which won’t land for weeks. By which point several private issuers will have reported, restructuring conversations will have advanced, and the window for refinancing will have narrowed further.
The current bull case requires a specific sequence:
The ceasefire holds.
Oil normalizes by mid-year.
The Fed acknowledges slowing growth and signals cuts.
Mortgage rates ease.
Spring data surprises.
The names that survive to that environment with balance sheets intact become compelling. Fixed rate or hedged debt, manageable leverage, revenue weighted toward R&R rather than pure new construction. That profile exists in this sector. It is not the profile of the names currently generating the most attention.
For the most distressed names the question was never whether housing recovers. Housing always recovers. The lock-in effect is a coiled spring. Pent-up demand is real. Demographics still favor household formation. The structural case for an eventual recovery is not in dispute.
The question is whether the recovery arrives before the maturity clock runs out.
The restructuring happens before the recovery arrives. The businesses survive in some form. The capital structures don’t. And by the time the housing market finally thaws and transaction volume returns and completions pick back up, the names that make it to that environment will be reorganized entities with cleaned-up balance sheets, new ownership, and no memory of what the debt cost their predecessors.
That’s the tragedy of the timing. Playing out in credit markets, in BSLs, high yield, and private credit, in secondary prices that most people aren’t watching.
The Names
Here are the specific names I’m tracking in building products right now, organized by where they sit on the distress spectrum, with current prices and yields.
This isn’t a recommendation to buy or sell anything. If the spring selling season data disappoints and the private issuer earnings confirm what the public name downgrades are already signaling, the names below are where the restructuring conversations start.
The other side of that trade is also worth understanding. When the housing market does recover, the names that survive to that environment in their current capital structures will have significant convexity. Bonds trading at 20-40 cents don’t need perfection. They need the business to still exist and the recovery to arrive before the maturity clock runs out.