

Private Credit Unfiltered: The Transmission Mechanism Tested
Is BDC Stress Reaching the BSL Market Yet?
Credit analysts love a clean thesis.
This one is very clean. Non-traded BDCs are facing the biggest redemption wave of their existence. They’re also sitting on $140 billion of broadly syndicated loans. BSLs are liquid, marked to observable prices, and can be sold in days. So that’s where the BDCs go to meet redemptions. Forced selling hits the tape, BSL prices dislocate in specific names for technical reasons, and public credit takes the hit.
Indiscriminate selling. The kind of thesis that reads well in a strategist note and gets repeated at every credit roundtable for six months running.
The question is whether it’s actually showing up in prices.
So I pulled the data.
The Mechanics Are Worth Walking Through
The entire thesis rests on BDCs being forced sellers of BSLs, and before getting to whether they are, it’s worth laying out what a non-traded BDC actually does when a tender window opens. Most commentary skips the part where a BDC’s funding hierarchy absorbs redemption pressure long before it ever reaches the Level 2 bucket, and that’s where the thesis tends to overreach.
A non-traded BDC facing a tender window has to meet redemption requests within 90 days, capped at 5% of NAV under standard repurchase policies. The cash comes from six places, roughly in order of cost.
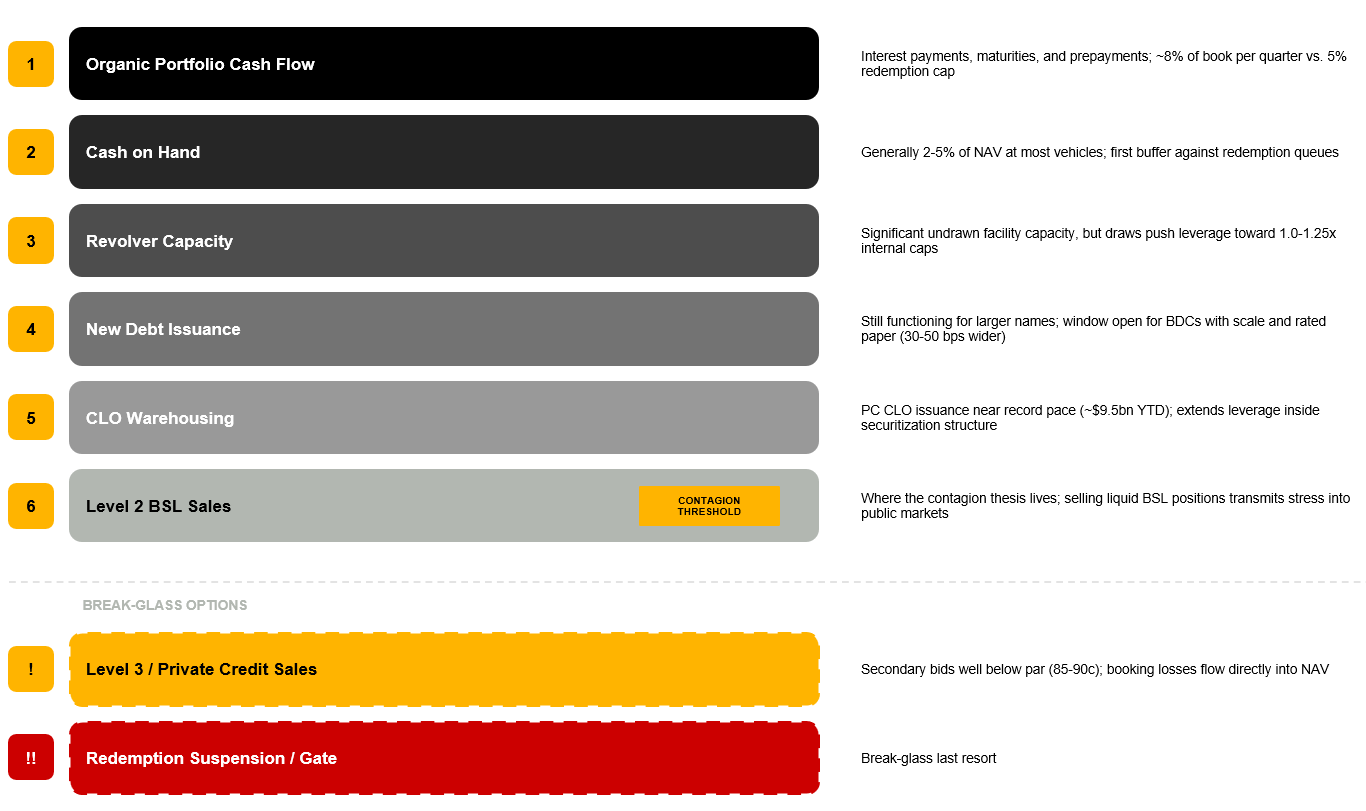
The first source is organic portfolio cash flow. Interest payments, loan maturities, and prepayments generate meaningful liquidity every quarter.
OTIC disclosed $1.3bn in liquidity against a $6bn book. OCIC reported $11.3bn. Industry-wide portfolio cash flow has historically run around 8% per quarter, comfortably above the 5% redemption cap. That historical average may understate current conditions though, given rising PIK, slower prepayments, and extension activity.
Cash on hand comes next, generally 2-5% of NAV at most vehicles.
After that, revolver capacity. Most BDCs carry significant undrawn capacity on their credit facilities, but each draw pushes leverage toward the 1.0-1.25x internal cap these vehicles operate under. Breaching the cap carries real consequences: ratings pressure, tighter covenants on the next refinancing, reduced NII as interest expense climbs.
New debt issuance sits fourth in the hierarchy and it’s still functioning for the larger names. GSCRED and OBDC both printed notes this week at spreads 30-50 bps wider than where they would have cleared six months ago, but the window is open for BDCs with scale and rated paper.
CLO warehousing is the fifth lever. Private credit CLO issuance is running near record pace this year, roughly $9.5bn YTD, with BDCs retaining meaningful portions of junior tranches across the industry. That extends leverage one level deeper inside the securitization in a way that doesn’t surface cleanly in the headline debt-to-equity ratio, but it generates cash.
Level 2 BSL sales come sixth. This is where the contagion thesis lives.
Beneath that sit Level 3 sales, which is the ugly option because secondary bids for private credit paper sit below par and selling at 85 or 90 cents means booking losses that flow into NAV. Suspending redemptions is the break-glass last resort.
Nobody’s forecfully selling yet. At least not meaningfully below par.
The implication of the hierarchy is that BSL selling only begins once the upstream levers are substantially exhausted. If portfolio cash flow, revolvers, debt issuance, and CLO warehousing are still absorbing the redemption pressure, the transmission into public markets simply doesn’t activate. The question of whether the mechanism is live becomes, more precisely, a question of whether Q1 pushed those upstream levers far enough.
Q1 Put Real Pressure On Those Levers
The entire non-traded BDC industry either capped or stretched at the 5% redemption limit in the same quarter, which is a different situation from the episodic pressure individual vehicles have faced in prior cycles.

Back-leverage terms have tightened meaningfully across the major banks, with spreads widening 50-150 bps over the past six months. JPMorgan, Goldman, and Barclays are exercising markdown rights on collateral that most sponsors assumed would never actually be used in practice.
Fundraising has stalled alongside all of this. Direct lending raised $10.7bn in Q1 against $27.7bn in Q4, which removes the flywheel dynamic where new AUM historically funded distributions in the background while the portfolio matured.

None of the top four levers have exhausted. But they’re all under real pressure simultaneously, and the pressure is compounding rather than dissipating. If redemption requests persist through this year and next at anywhere near the Q1 pace, the buffers thin out and the marginal cost of each successive draw rises.
Which shifts the question from whether BSL selling could eventually happen to what it would look like when the relief valve opens. That turns on what BDCs are actually holding in the Level 2 bucket.
The Level 2 Bucket Isn’t A Random Slice Of The BSL Market

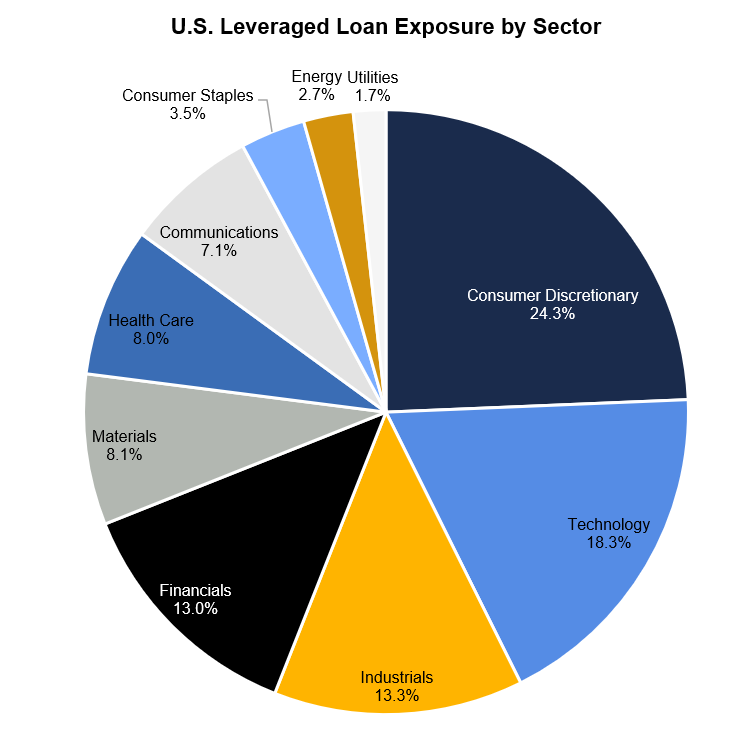
BDCs don’t accumulate Level 2 positions randomly. They hold BSLs that overlap with their private origination footprint, which skews the bucket toward the same sectors where those BDCs lend privately. Software, business services, and healthcare services are disproportionately represented in the Level 2 book relative to their weight in the Leveraged Loan Index, and the concentration is meaningful enough to matter when the selling starts.
The problem with that concentration is that it’s already adverse. These are the sectors where CLO managers have been pulling back on new exposure for several quarters, for all the AI-disruption reasons the market has been working through since the fall. Which means the marginal BSL seller (a BDC meeting redemptions) meets the marginal BSL buyer (a CLO that’s already trying to reduce exposure to the same sectors) in precisely the credits where both sides are most stressed.
Prices gap rather than drift when the buy and sell sides are concentrated in the same names, and a BDC balance sheet problem becomes a BSL market problem at that point. From there the situation compounds, because the BSL market doesn’t absorb concentrated selling passively. It has a buyer base with hard structural constraints that can shift from absorber to amplifier faster than most of the contagion commentary has acknowledged.
Why CLOs Can Flip From Absorber To Amplifier
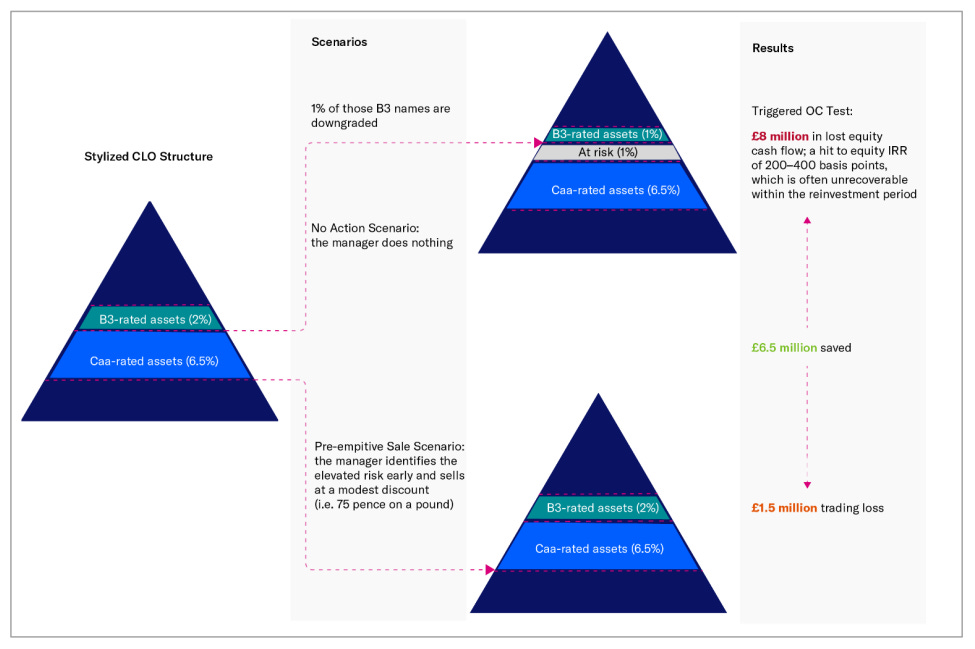
CLOs hold roughly 70% of the BSL market, which makes them the structural buyer, but the extent to which they absorb forced selling or amplify it depends heavily on how constrained their balance sheets are when the selling starts. CLO managers don’t buy unlimited quantities at any price. Overcollateralization (“OC”) tests require the collateral pool to maintain minimum par value relative to the debt tranches, CCC baskets cap exposure to distressed credits, and weighted average price tests constrain overall portfolio composition.
A CLO that buys a stressed loan at 85 cents and holds to maturity is generally fine on expected P&L. But if that loan gets downgraded or other loans in the portfolio get marked down, the OC test can fail, which triggers cash diversion away from equity holders and toward paying down senior debt. Managers running tight OC cushions can’t absorb forced selling even when they’d like to, and when the selling concentrates in specific sectors where CLO exposure is already elevated, the constraint binds faster than it would in a more diversified selling wave.
The cascade from there is fairly predictable.
Imagine BDCs sell BSLs into weakening CLO demand. Prices widen in the concentrated sectors. OC tests tighten. CLO managers stop adding and start rebalancing out of the weakest names. BSL widens further. New CLO issuance slows because the arbitrage math breaks at wider spreads, and CLO warehouses that were loaded in Q4 2025 at tighter levels get stuck holding paper that can’t price cleanly into a deal.
The knock-on effect reaches past secondary prices. Private credit borrowers who were planning to refinance their PC debt into BSL, which could be a natural release valve for stressed PC loans throughout this cycle, find the venue either closed or too expensive. They get pushed back into PC-internal solutions: amend-and-extend transactions, PIK toggles, liability management exercises. Which increases PC stress, which increases BDC redemption pressure, which forces more BSL selling.
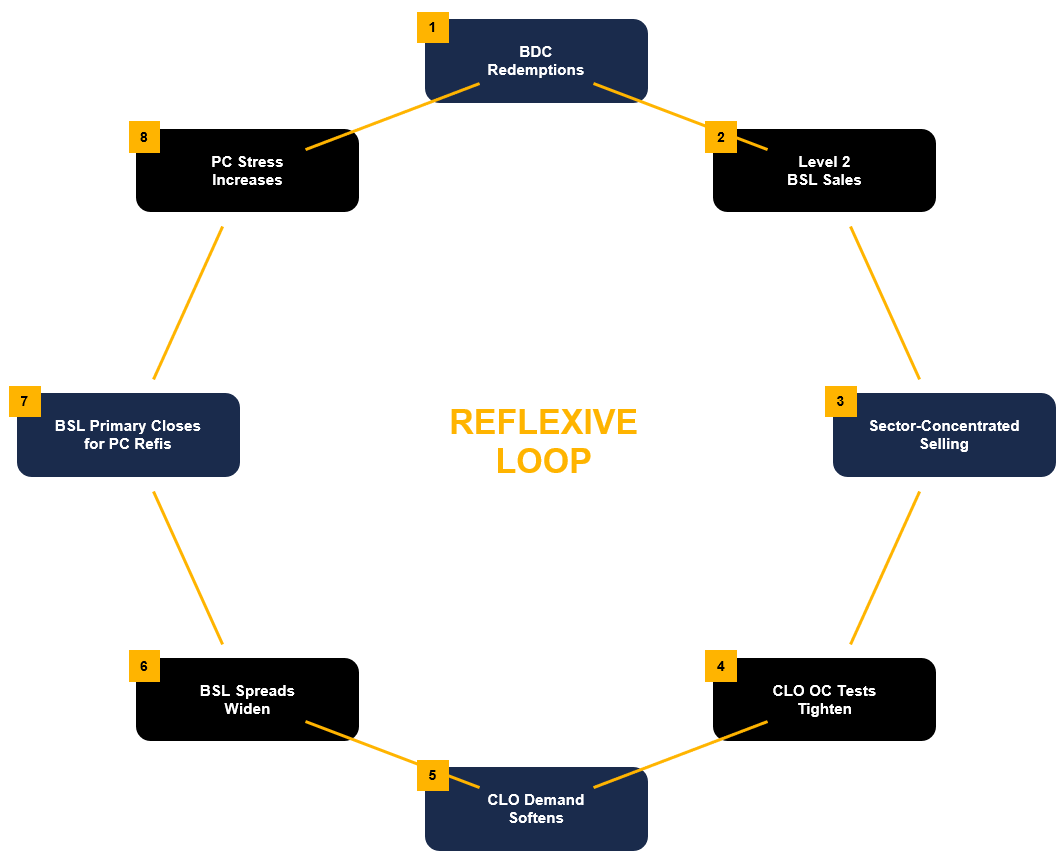
Private credit stress transmits to public credit through the BDC BSL sleeve, and public credit weakness reflects back into private credit by closing the BSL refinancing channel. The loop feeds itself once it starts, which is why the question of whether it’s started matters more than the question of whether the mechanism could exist in principle.
The Thesis Is Clean. The Question Is Whether The Data Agrees.
The argument above sounds good on paper. The mechanism is coherent. The funding hierarchy is real. The redemption pressure is real. The sector concentration is real. The CLO feedback dynamics are real.
If the mechanism is live, the evidence should show up in BSL prices for the specific credits that BDCs are most likely to be selling. The concentrated sectors should be widening faster than the aggregate index. Names that appear across multiple BDC Level 2 books should be underperforming otherwise-comparable names that don’t.
That’s testable.
So I picked a non-traded BDC with meaningful BSL exposure, pulled up its BSLs, and priced each one at three specific points: December 31, 2025 as year-end, March 3, 2026 as the leveraged loan market low, and April 20, 2026 as current. Then I compared the movement of those names against the aggregate leveraged loan index and the technology subindex, to see whether the BDC-held names were moving with the broader market or showing concentrated selling pressure beyond what the index reflected.
Here’s what I found.