

CION Baby Bonds ($CICC): Opportunity or Trap?
A closer look at CION’s portfolio marks, leverage, and newly issued baby bonds.

CION issued baby bonds this year. Only $135 million, now trading below par to yield just under 8%.
Baby bonds are a retail product: sold in $25 increments, listed on an exchange and often bought by investors screening for coupons. This one pays 7.50%. I’d bet most buyers never opened CION’s schedule of investments, and a security priced without one gets mispriced in both directions.
Sometimes the panic is wrong and the paper is cheap. Sometimes the coupon does the selling and the paper is rich.
Which one is this? I thought it would be interesting to find out.
Background
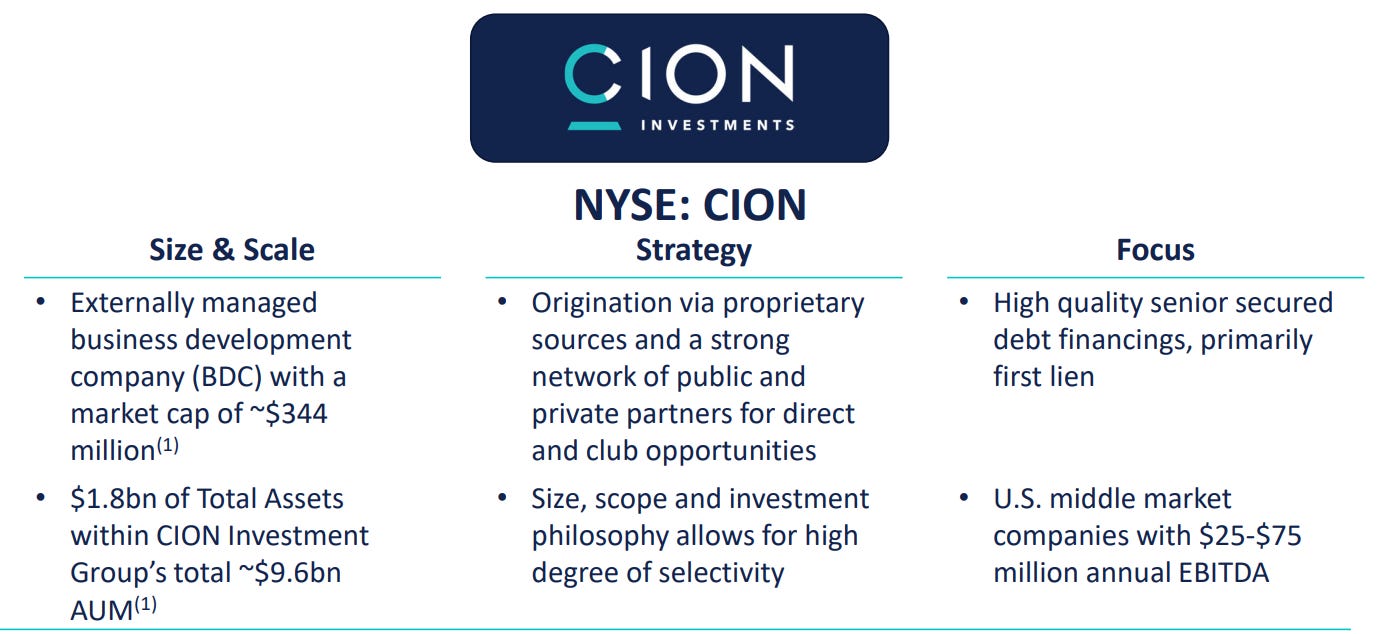
CION Investment Corporation (“CION”) is an externally-managed BDC lending to mid-market companies in the US. Mostly senior secured loans plus a collection of equity and restructuring positions accumulated through prior workouts.
The past year has not been kind to the portfolio. Fair value went from ~$1.79bn in 1Q’25 to $1.70bn in 1Q’26, the # of companies from 104 to 89, net assets from $757mm to $660mm, and NAV per share from $14.28 to $13.11.
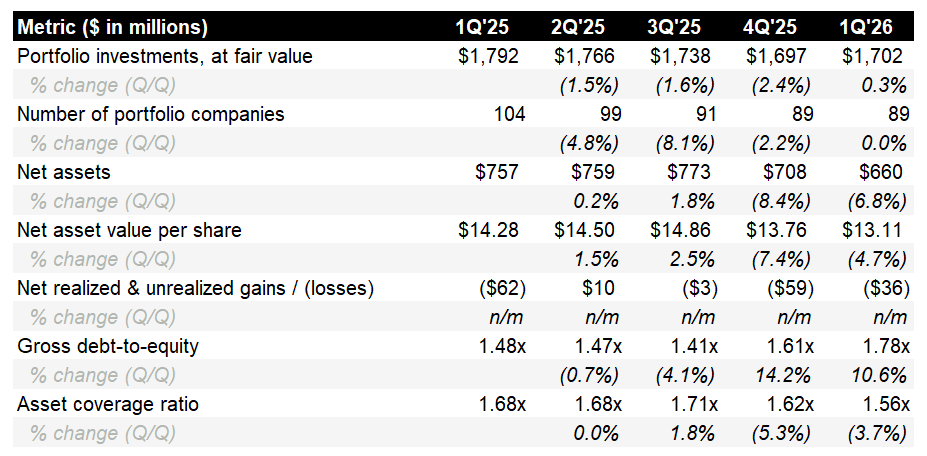
And lately it’s been getting worse faster: $59mm of unrealized losses in 4Q’25, another $36mm in 1Q’26, gross debt-to-equity now at 1.78x. Asset coverage sits at 156% against a 150% requirement.
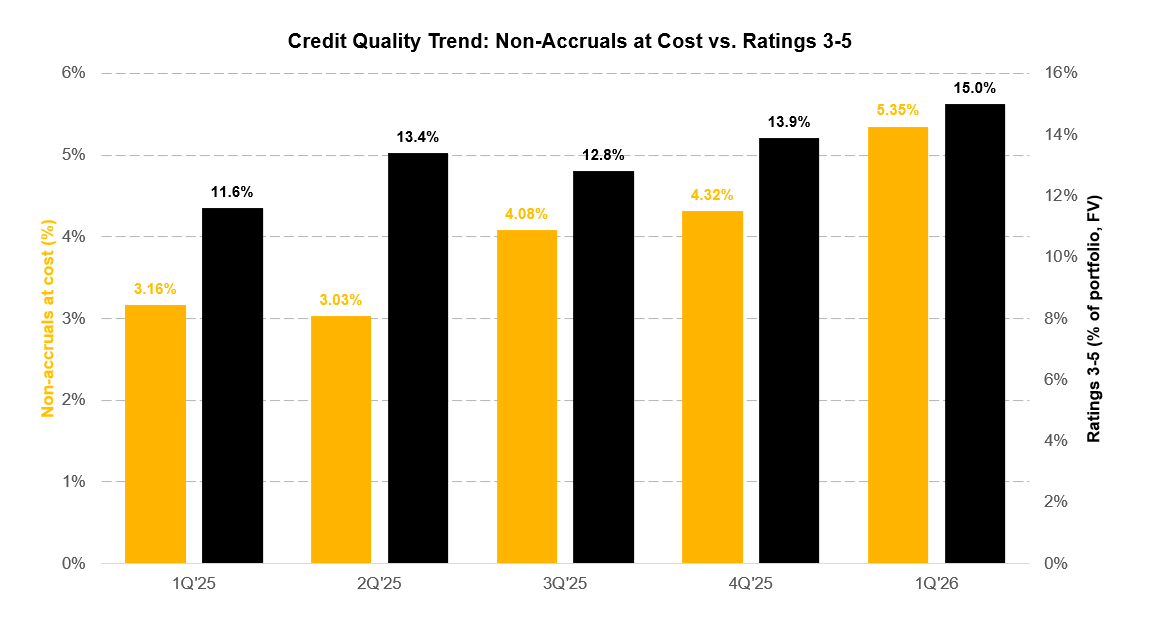
Credit quality tells the same thing. During the quarter, non-accruals rose from 4.32% to 5.35% of cost, the internally rated 3-through-5 bucket reached 15.0% of fair value, and borrower interest coverage slipped from 2.26x to 2.08x. At fair value, non-accruals are just 1.53%, and that low number should not reassure anyone. It’s low because the weakest positions have already been written down substantially.
Earnings quality is deteriorating too. PIK interest ran ~22% of total investment income in the first quarter, and after financing and operating costs, most of what remained of earnings arrived as accruals rather than cash.
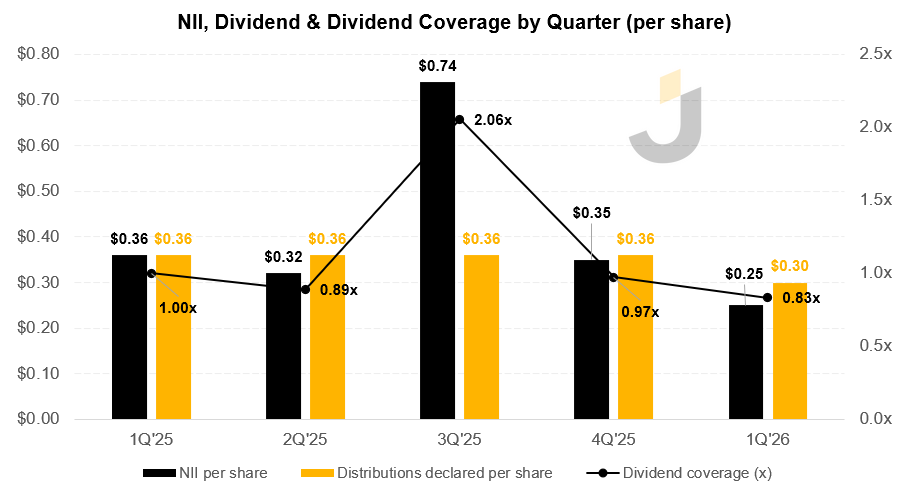
Unsurprisingly, the reduced dividend is not covered by current quarterly NII, and recurring cash earnings fall far shorter. 1Q’26 NII of $0.25 vs. a $0.30 payout, and if you exclude one unusually strong quarter (3Q’25), coverage has been at or below 1.0x in 4 of the past 5.
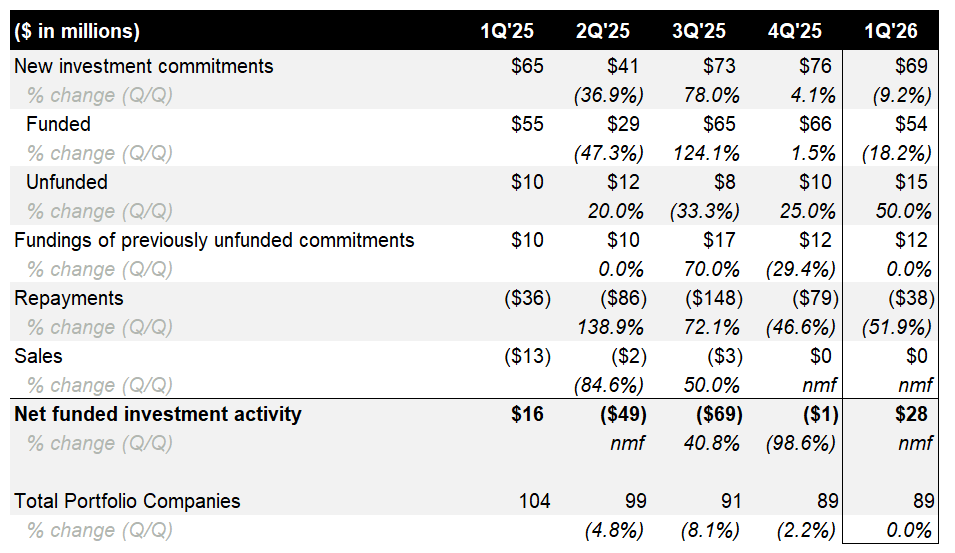
Management has bought back some stock though. $9.7mm during the quarter at an average of $8.71, accretive to NAV at reported marks, but eating into liquidity. This comes at a time when the book is shrinking, with ~$265mm funded against ~$356mm of repayments/sales over the LTM, netting to $91mm of runoff.
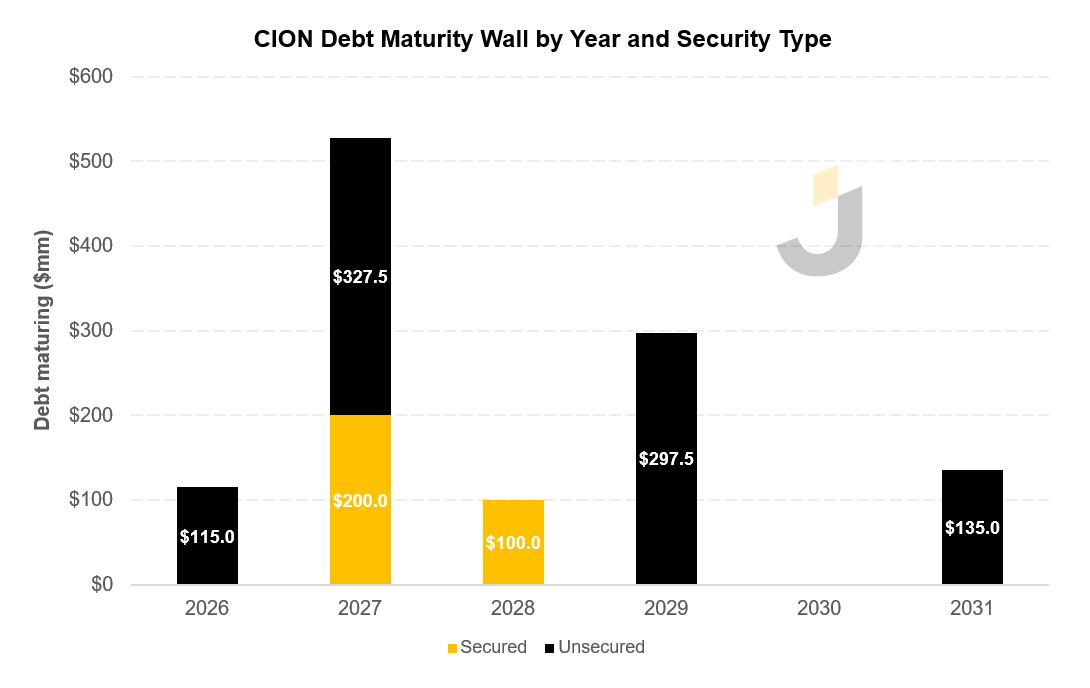
Against that backdrop, CION sold $135mm of 7.50% unsecured notes due 2031 in February 2026 and used part of the proceeds to repay $100mm on its JPM facility. Longer duration, less secured debt, fine as far as it goes. But it doesn’t go very far, because $115mm still matures in 2026 and more than $500mm in 2027.
Portfolio Overview
Before the numbers, it’s worth knowing what CION actually owns.
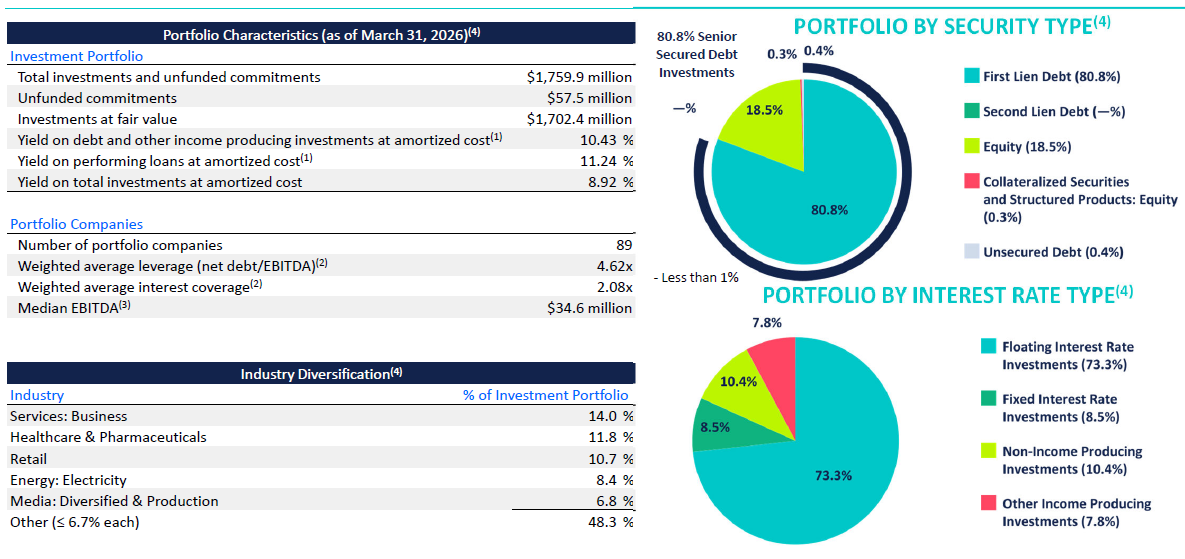
The book comprises 89 companies across 23 industries, mid-market borrowers with $25mm to $75mm of EBITDA (median of $35mm).
Sector exposure is diversified but not featureless. Business services leads at 14.0%, healthcare at 11.8%, then retail at 10.7%, electricity at 8.4%, and diversified media at 6.8%, with everything else below 6.7% each. Business services and healthcare are standard direct-lending. Double-digit retail is less standard, and given where the marks sit, worth keeping in mind when we get to the near-term maturity cohort.
The origination model matters for reading the marks too. Alongside directly originated and club loans, CION runs an opportunistic strategy: buying illiquid, lightly syndicated 1L paper at discounts created by ratings or technical pressure. There’s also a joint venture with EagleTree Capital, formed in late 2021, that pursues higher-yielding and junior-capital deals.
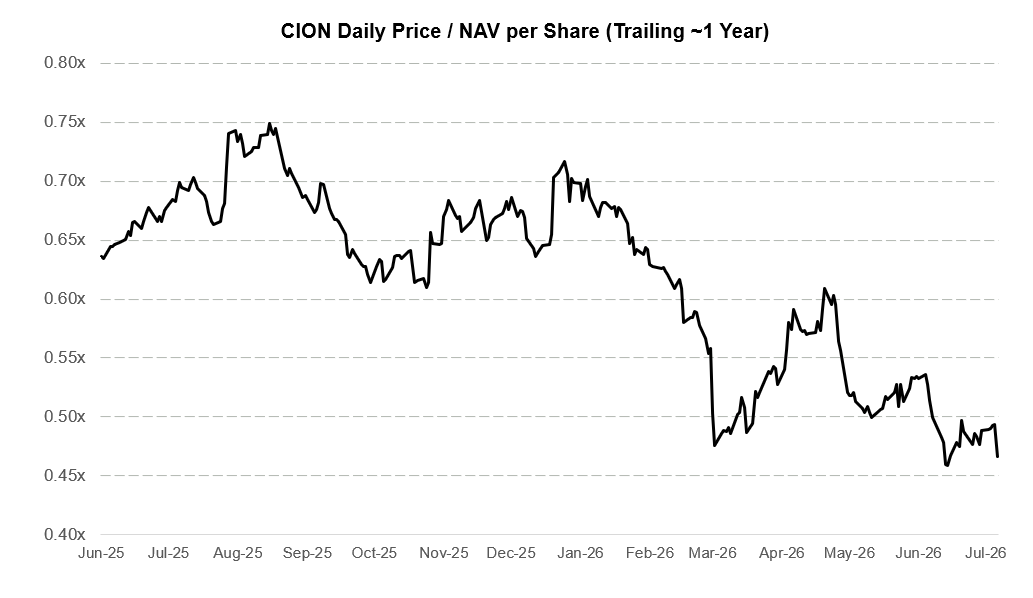
One more piece of context on the situation: the market has already voted. CION trades at 0.47x NAV against 0.74x for the BDC universe, carries 162% net leverage against a peer average of 119%, and shows non-accruals at cost of 5.35% against 3.50% for peers. The trailing distribution yield is 20%+. A yield like that is the market telling you it doesn’t believe the payout, the NAV, or both.
Estimating the Portfolio’s Fair Value
Management reports $1.70bn of fair value (excluding $97mm of short-term Treasuries) against ~$1.87bn of cost, for NAV of $660mm, or $13.11 per share. I treat reported fair value as the management case, not as an independently underwritten recovery value.
Here’s how I go about re-marking the current portfolio: